INVITE-ONLY SCRIPT
[LTS] SyncLine
Find the hidden currents between markets.
What it does
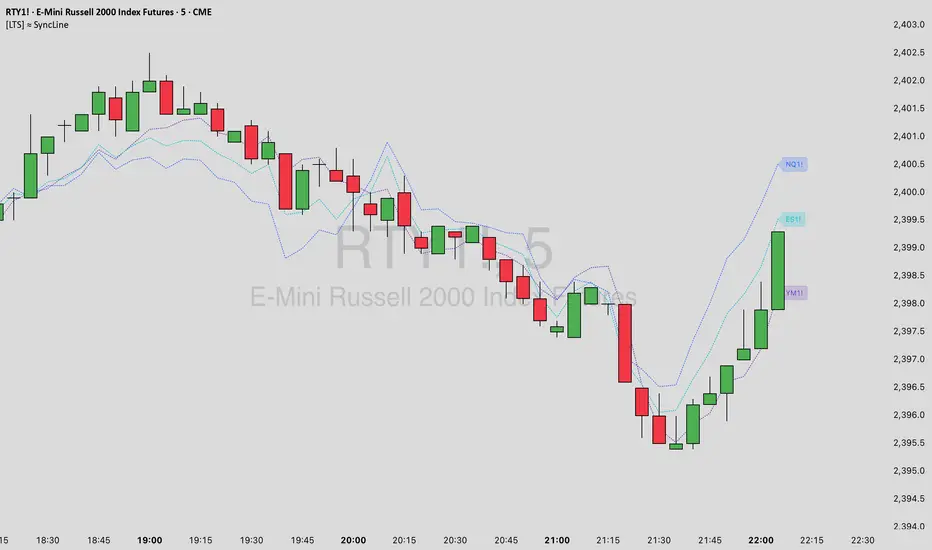
SyncLine overlays up to three cross-asset guide lines on your current chart, translating each selected symbol’s intraday position into the price scale of the chart you’re viewing. The result is a clean, session-aware “sync” of other markets on your chart so you can quickly spot alignment, leadership, and divergence without clutter.
How it works
For each selected symbol, SyncLine calculates that symbol’s intraday position relative to its own session baseline, then projects that position onto your active chart based on its own baseline.
Lines reset each session to remain relevant to the current day’s action.
Optional smoothing makes the guides easier to read during noisy tape.
Note: This script is intraday-only. It will stop with a clear warning if applied to non-intraday timeframes.
Inputs
Symbols
Smoothing
How to use
Add one or more driver markets (e.g., ES, NQ, DXY, sector leaders) to observe when they align with your instrument.
Look for:
Confluence: your price and one or more SyncLines moving together.
Leadership: a SyncLine turns/accelerates before your price.
Divergence: your price disagrees with the majority of SyncLines.
Notes & limitations
Designed for intraday timeframes (1m–1h).
Lines are calculated from completed data and do not repaint after bar close.
Works best during regular liquid sessions; thin markets can reduce signal quality.
Best practices
Pair SyncLine with your execution framework (structure, liquidity zones, time-of-day).
Use distinct colors for each symbol and keep the set small (1–3) for clarity.
What it does
SyncLine overlays up to three cross-asset guide lines on your current chart, translating each selected symbol’s intraday position into the price scale of the chart you’re viewing. The result is a clean, session-aware “sync” of other markets on your chart so you can quickly spot alignment, leadership, and divergence without clutter.
How it works
For each selected symbol, SyncLine calculates that symbol’s intraday position relative to its own session baseline, then projects that position onto your active chart based on its own baseline.
Lines reset each session to remain relevant to the current day’s action.
Optional smoothing makes the guides easier to read during noisy tape.
Note: This script is intraday-only. It will stop with a clear warning if applied to non-intraday timeframes.
Inputs
Symbols
- Show Symbol 1/2/3 – Toggle each overlay line.
- Symbol 1/2/3 – Choose any ticker (e.g., index futures, ETFs, single names).
- Color 1/2/3 – Line colors.
- Labels - Optional labels for each line.
Smoothing
- Enable Smoothing – On/Off.
- Method – EMA / SMA / WMA / RMA.
- Length – 1–50.
How to use
Add one or more driver markets (e.g., ES, NQ, DXY, sector leaders) to observe when they align with your instrument.
Look for:
Confluence: your price and one or more SyncLines moving together.
Leadership: a SyncLine turns/accelerates before your price.
Divergence: your price disagrees with the majority of SyncLines.
Notes & limitations
Designed for intraday timeframes (1m–1h).
Lines are calculated from completed data and do not repaint after bar close.
Works best during regular liquid sessions; thin markets can reduce signal quality.
Best practices
Pair SyncLine with your execution framework (structure, liquidity zones, time-of-day).
Use distinct colors for each symbol and keep the set small (1–3) for clarity.
招待専用スクリプト
こちらのスクリプトにアクセスできるのは投稿者が承認したユーザーだけです。投稿者にリクエストして使用許可を得る必要があります。通常の場合、支払い後に許可されます。詳細については、以下、作者の指示をお読みになるか、LHAMA-Tradingに直接ご連絡ください。
スクリプトの機能を理解し、その作者を全面的に信頼しているのでなければ、お金を支払ってまでそのスクリプトを利用することをTradingViewとしては「非推奨」としています。コミュニティスクリプトの中で、その代わりとなる無料かつオープンソースのスクリプトを見つけられる可能性もあります。
作者の指示
This indicator is part of the LHAMA Trading Suite. See https://lhamatrading.com for access.
警告: 招待専用スクリプトへのアクセスをリクエストする前に弊社のガイドをお読みください。
Creators of the LHAMA Trading Suite. Visit lhamatrading.com to unlock all our indicators.
Skip the drama, ride the LHAMA!
Skip the drama, ride the LHAMA!
免責事項
これらの情報および投稿は、TradingViewが提供または保証する金融、投資、取引、またはその他の種類のアドバイスや推奨を意図したものではなく、またそのようなものでもありません。詳しくは利用規約をご覧ください。