INVITE-ONLY SCRIPT
更新済 The Strat Patterns Indicator v1.0
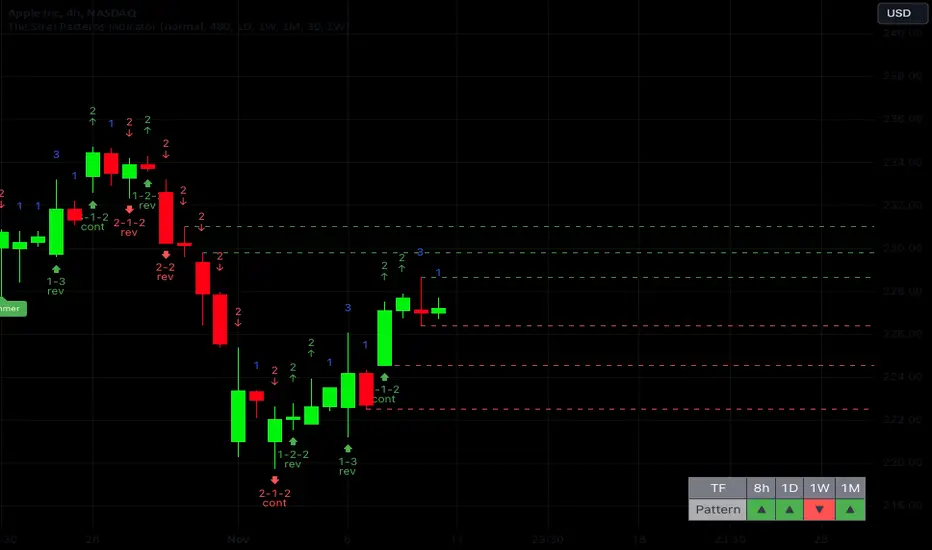
The Strat Patterns Indicator is a tool that draws Strat patterns in real-time, highlights Strat scenarios, key levels, and helps traders effectively apply the Strat trading strategy.
It combines features such as pattern recognition, timeframe continuity analysis, target level highlighting, and custom alerts to simplify trading decisions and maximize profit potential.
Display All Strat Patterns
The Strat Patterns Indicator shows all Strat patterns directly on your chart, making it easier to spot trading opportunities in real-time. You can choose to show or hide specific patterns based on your preferences. The patterns include:

Highlight Major Candlestick Patterns
The indicator highlights important candlestick formations that are crucial for forecasting the major trend reversals in the market. These candlestick patterns include:
By showcasing these patterns, the indicator helps traders quickly identify possible reversals or continuations, providing an extra layer of confirmation for trading decisions.

Timeframe Continuity Table
This indicator includes a customizable table that displays timeframe continuity, allowing you to align your trades with the overall market trend. You can select up to four higher timeframes to monitor, helping you ensure that your trades follow the broader trend direction.
This feature makes it easy to identify whether the market trend is aligned across multiple timeframes, enhancing your ability to make high-probability trades.

Show Target Levels (Previous Highs/Lows)
The indicator highlights target levels based on previous highs or lows, making it easier to set realistic profit targets and manage trades effectively.
By identifying these key levels, you can better gauge potential price movements and plan your trades with greater precision, ensuring that you maximize profit opportunities while minimizing risk.

Highlight Higher Timeframe Target Levels
This feature allows you to display target levels from a higher timeframe while trading on a lower timeframe.
For example, if you are trading on a 4-hour chart, you can choose to show daily target levels, including high/low levels and Fibonacci golden ratios. This helps you identify more significant profit targets and enhances your ability to capture larger moves while staying aligned with the overall trend.

Breakout Confirmation
The indicator provides an option to display the previous candlestick's high or low value, helping you confirm breakouts in Strat patterns. This feature is useful for validating whether a true breakout has occurred, giving you greater confidence in your trade entries and helping you avoid potential false breakouts.
Alerts for Strat Patterns
With this feature, you can set up alerts that trigger whenever a Strat pattern forms. This ensures you never miss a trading opportunity, keeping you informed and ready to act when key patterns emerge. The alerts provide real-time notifications, allowing you to stay on top of market movements without constantly monitoring your charts.
It combines features such as pattern recognition, timeframe continuity analysis, target level highlighting, and custom alerts to simplify trading decisions and maximize profit potential.
Display All Strat Patterns
The Strat Patterns Indicator shows all Strat patterns directly on your chart, making it easier to spot trading opportunities in real-time. You can choose to show or hide specific patterns based on your preferences. The patterns include:
- 2-2 Continuation
- 2-2 Reversal
- 3-2-2 Reversal
- 2-1-2 Continuation
- 2-1-2 Reversal
- 1-2-2 Reversal
- 3-1-2 Continuation
- 1-3 Reversal
- 3-1-2 Reversal
Highlight Major Candlestick Patterns
The indicator highlights important candlestick formations that are crucial for forecasting the major trend reversals in the market. These candlestick patterns include:
- Hammer
- Shooting Star
- Doji
- Gravestone Doji
- Dragonfly Doji
- Morning Doji Star
- Evening Doji Star
By showcasing these patterns, the indicator helps traders quickly identify possible reversals or continuations, providing an extra layer of confirmation for trading decisions.
Timeframe Continuity Table
This indicator includes a customizable table that displays timeframe continuity, allowing you to align your trades with the overall market trend. You can select up to four higher timeframes to monitor, helping you ensure that your trades follow the broader trend direction.
This feature makes it easy to identify whether the market trend is aligned across multiple timeframes, enhancing your ability to make high-probability trades.
Show Target Levels (Previous Highs/Lows)
The indicator highlights target levels based on previous highs or lows, making it easier to set realistic profit targets and manage trades effectively.
By identifying these key levels, you can better gauge potential price movements and plan your trades with greater precision, ensuring that you maximize profit opportunities while minimizing risk.
Highlight Higher Timeframe Target Levels
This feature allows you to display target levels from a higher timeframe while trading on a lower timeframe.
For example, if you are trading on a 4-hour chart, you can choose to show daily target levels, including high/low levels and Fibonacci golden ratios. This helps you identify more significant profit targets and enhances your ability to capture larger moves while staying aligned with the overall trend.
Breakout Confirmation
The indicator provides an option to display the previous candlestick's high or low value, helping you confirm breakouts in Strat patterns. This feature is useful for validating whether a true breakout has occurred, giving you greater confidence in your trade entries and helping you avoid potential false breakouts.
Alerts for Strat Patterns
With this feature, you can set up alerts that trigger whenever a Strat pattern forms. This ensures you never miss a trading opportunity, keeping you informed and ready to act when key patterns emerge. The alerts provide real-time notifications, allowing you to stay on top of market movements without constantly monitoring your charts.
リリースノート
Updated Alerts Feature招待専用スクリプト
このスクリプトは作者が承認したユーザーのみアクセス可能です。使用するにはアクセス申請をして許可を得る必要があります。通常は支払い後に承認されます。詳細は下記の作者の指示に従うか、ForexBeeに直接お問い合わせください。
TradingViewは、作者を完全に信頼し、スクリプトの動作を理解していない限り、有料スクリプトの購入・使用を推奨しません。コミュニティスクリプトには無料のオープンソースの代替が多数あります。
作者の指示
📩 To request access to indicator, please send us a message or visit our website 🌐 https://forexbee.co/the-strat-patterns-indicator/ . We’ll be happy to assist you!
🚀 Thank you for your interest!
ForexBee
免責事項
この情報および投稿は、TradingViewが提供または推奨する金融、投資、トレード、その他のアドバイスや推奨を意図するものではなく、それらを構成するものでもありません。詳細は利用規約をご覧ください。
招待専用スクリプト
このスクリプトは作者が承認したユーザーのみアクセス可能です。使用するにはアクセス申請をして許可を得る必要があります。通常は支払い後に承認されます。詳細は下記の作者の指示に従うか、ForexBeeに直接お問い合わせください。
TradingViewは、作者を完全に信頼し、スクリプトの動作を理解していない限り、有料スクリプトの購入・使用を推奨しません。コミュニティスクリプトには無料のオープンソースの代替が多数あります。
作者の指示
📩 To request access to indicator, please send us a message or visit our website 🌐 https://forexbee.co/the-strat-patterns-indicator/ . We’ll be happy to assist you!
🚀 Thank you for your interest!
ForexBee
免責事項
この情報および投稿は、TradingViewが提供または推奨する金融、投資、トレード、その他のアドバイスや推奨を意図するものではなく、それらを構成するものでもありません。詳細は利用規約をご覧ください。