PROTECTED SOURCE SCRIPT
更新済 Market Breadth - Primary Indicator
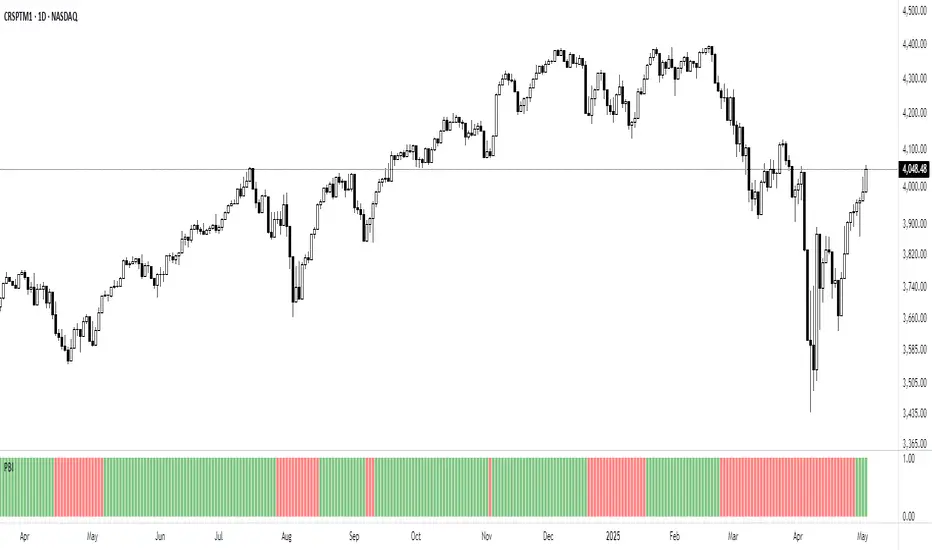
Market Breath is the equilibrium between number of stocks in advance to those in a decline, in other words a method to determine the current market environment. In a positive phase bullish setups will have improved probabilities and presence, whereas in a bearish phase the opposite would be true.
The primary indicator measure the trend in SPY and correlation between different EMA's.
- Green Columns: Positive Breadth
- Red Columns: Negative Breadth
This indicator can be combined with the secondary breadth indicator to further note excessive movement and risk of mean reversion.
The primary indicator measure the trend in SPY and correlation between different EMA's.
- Green Columns: Positive Breadth
- Red Columns: Negative Breadth
This indicator can be combined with the secondary breadth indicator to further note excessive movement and risk of mean reversion.
リリースノート
You can now customize which symbol / market the indicator will be based on.リリースノート
This version is now based on NASDAQ:CRSPTM1, which tracks the US Total Market Index. This expands coverage to a broader spectrum of U.S. equities.リリースノート
Updated chart and color scheme.保護スクリプト
このスクリプトのソースコードは非公開で投稿されています。 ただし、制限なく自由に使用できます – 詳細はこちらでご確認ください。
Technical Trading: Research and Application
stockleave.com/
stockleave.com/
免責事項
この情報および投稿は、TradingViewが提供または推奨する金融、投資、トレード、その他のアドバイスや推奨を意図するものではなく、それらを構成するものでもありません。詳細は利用規約をご覧ください。
保護スクリプト
このスクリプトのソースコードは非公開で投稿されています。 ただし、制限なく自由に使用できます – 詳細はこちらでご確認ください。
Technical Trading: Research and Application
stockleave.com/
stockleave.com/
免責事項
この情報および投稿は、TradingViewが提供または推奨する金融、投資、トレード、その他のアドバイスや推奨を意図するものではなく、それらを構成するものでもありません。詳細は利用規約をご覧ください。