INVITE-ONLY SCRIPT
更新済 Swing elite Trend direction
Swing elite Trend direction
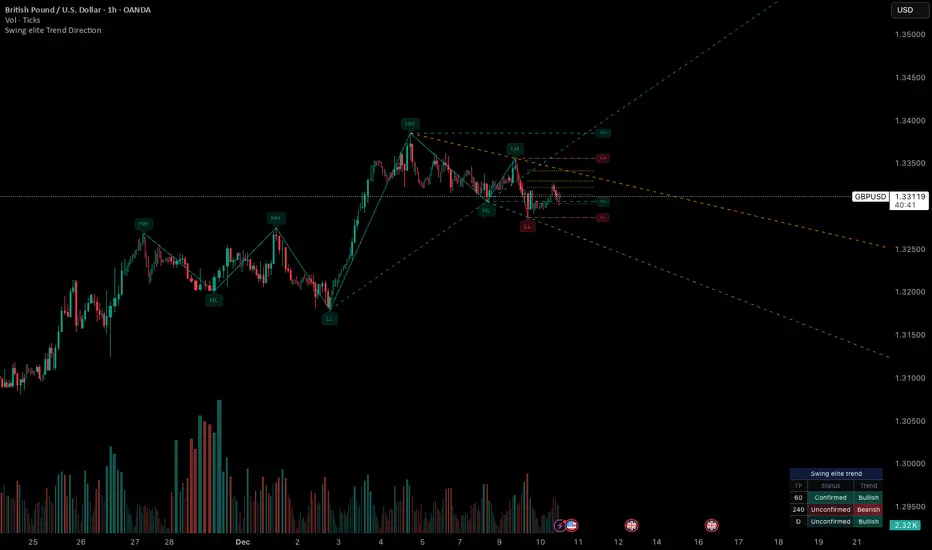
A comprehensive market structure indicator that identifies swing highs/lows, labels them with HH/HL/LH/LL structure, draws dynamic trendlines, and provides multi-timeframe trend analysis.
🔹 FEATURES
Market Structure Analysis
Automatically detects swing highs and swing lows
Labels each pivot with its structure type: HH (Higher High), HL (Higher Low), LH (Lower High), LL (Lower Low)
Color-coded zigzag lines based on confirmed trend direction
Structure Trendlines
Downtrend Line: Connects HH to LH (resistance in bearish structure)
Uptrend Line: Connects LL to HL (support in bullish structure)
Extended projection for potential future price interaction
Swing Trendlines
Connects the last 2 swing highs (resistance trendline)
Connects the last 2 swing lows (support trendline)
Optional extension to project future levels
Break Levels
Horizontal lines at key structure points (HH, HL, LL, LH)
Visual reference for potential breakout/breakdown levels
Customizable colors for bullish and bearish breaks
Fibonacci Retracement
Auto-drawn between the last two pivots
Customizable levels: 0, 0.236, 0.382, 0.5, 0.618, 0.786, 1.0
Individual toggle and color settings for each level
Multi-Timeframe Dashboard
Displays trend status across 3 customizable timeframes
Shows trend direction: Bullish / Bearish / Neutral
Shows confirmation status: Confirmed / Unconfirmed
Color-coded for quick visual analysis
Trend Confirmation Logic (ICT/SMC Concepts)
Bullish Confirmed: HL followed by HH (Higher Low → Higher High pattern)
Bearish Confirmed: LH followed by LL (Lower High → Lower Low pattern)
Unconfirmed: Counter-structure appears (potential reversal signal)
🔹 SETTINGS
Swing Settings
Depth: Lookback period for pivot detection
Display
Toggle zigzag lines, labels, price on labels
Adjust label size and number of visible swings
Zigzag Settings
Line style: Solid, Dashed, Dotted
Thickness and colors for bullish/bearish trends
Swing Trendlines
Toggle high/low trendlines independently
Customizable colors, style, thickness
Option to extend trendlines
Structure Trendlines
Toggle HH→LH and LL→HL lines independently
Customizable colors, style, thickness
Option to extend trendlines
Break Levels
Toggle HH, HL, LL, LH break levels independently
Customizable colors for each level
Fibonacci
Toggle individual fib levels
Customizable colors and line style
Dashboard
Position: Top Left, Top Right, Bottom Left, Bottom Right
Size: Tiny, Small, Normal, Large
3 customizable timeframes
🔹 ALERTS
HH Broken: Price breaks above recent Higher High
HL Broken: Price breaks below recent Higher Low
LL Broken: Price breaks below recent Lower Low
LH Broken: Price breaks above recent Lower High
🔹 USE CASES
✅ Identify market structure and trend direction
✅ Spot potential trend reversals (unconfirmed status)
✅ Find key support/resistance levels
✅ Multi-timeframe trend alignment for trade confirmation
✅ Breakout/breakdown trading with break levels
✅ Fibonacci retracement entries
リリースノート
Swing elite Trend directionA comprehensive market structure indicator that identifies swing highs/lows, labels them with HH/HL/LH/LL structure, draws dynamic trendlines, and provides multi-timeframe trend analysis.
🔹 FEATURES
Market Structure Analysis
Automatically detects swing highs and swing lows
Labels each pivot with its structure type: HH (Higher High), HL (Higher Low), LH (Lower High), LL (Lower Low)
Color-coded zigzag lines based on confirmed trend direction
Structure Trendlines
Downtrend Line: Connects HH to LH (resistance in bearish structure)
Uptrend Line: Connects LL to HL (support in bullish structure)
Extended projection for potential future price interaction
Swing Trendlines
Connects the last 2 swing highs (resistance trendline)
Connects the last 2 swing lows (support trendline)
Optional extension to project future levels
Break Levels
Horizontal lines at key structure points (HH, HL, LL, LH)
Visual reference for potential breakout/breakdown levels
Customizable colors for bullish and bearish breaks
Fibonacci Retracement
Auto-drawn between the last two pivots
Customizable levels: 0, 0.236, 0.382, 0.5, 0.618, 0.786, 1.0
Individual toggle and color settings for each level
Multi-Timeframe Dashboard
Displays trend status across 3 customizable timeframes
Shows trend direction: Bullish / Bearish / Neutral
Shows confirmation status: Confirmed / Unconfirmed
Color-coded for quick visual analysis
Trend Confirmation Logic (ICT/SMC Concepts)
Bullish Confirmed: HL followed by HH (Higher Low → Higher High pattern)
Bearish Confirmed: LH followed by LL (Lower High → Lower Low pattern)
Unconfirmed: Counter-structure appears (potential reversal signal)
🔹 SETTINGS
Swing Settings
Depth: Lookback period for pivot detection
Display
Toggle zigzag lines, labels, price on labels
Adjust label size and number of visible swings
Zigzag Settings
Line style: Solid, Dashed, Dotted
Thickness and colors for bullish/bearish trends
Swing Trendlines
Toggle high/low trendlines independently
Customizable colors, style, thickness
Option to extend trendlines
Structure Trendlines
Toggle HH→LH and LL→HL lines independently
Customizable colors, style, thickness
Option to extend trendlines
Break Levels
Toggle HH, HL, LL, LH break levels independently
Customizable colors for each level
Fibonacci
Toggle individual fib levels
Customizable colors and line style
Dashboard
Position: Top Left, Top Right, Bottom Left, Bottom Right
Size: Tiny, Small, Normal, Large
3 customizable timeframes
🔹 ALERTS
HH Broken: Price breaks above recent Higher High
HL Broken: Price breaks below recent Higher Low
LL Broken: Price breaks below recent Lower Low
LH Broken: Price breaks above recent Lower High
🔹 USE CASES
✅ Identify market structure and trend direction
✅ Spot potential trend reversals (unconfirmed status)
✅ Find key support/resistance levels
✅ Multi-timeframe trend alignment for trade confirmation
✅ Breakout/breakdown trading with break levels
✅ Fibonacci retracement entries
3 hours ago
Release Notes
Swing elite Trend direction
A comprehensive market structure indicator that identifies swing highs/lows, labels them with HH/HL/LH/LL structure, draws dynamic trendlines, and provides multi-timeframe trend analysis.
🔹 FEATURES
Market Structure Analysis
Automatically detects swing highs and swing lows
Labels each pivot with its structure type: HH (Higher High), HL (Higher Low), LH (Lower High), LL (Lower Low)
Color-coded zigzag lines based on confirmed trend direction
Structure Trendlines
Downtrend Line: Connects HH to LH (resistance in bearish structure)
Uptrend Line: Connects LL to HL (support in bullish structure)
Extended projection for potential future price interaction
Swing Trendlines
Connects the last 2 swing highs (resistance trendline)
Connects the last 2 swing lows (support trendline)
Optional extension to project future levels
Break Levels
Horizontal lines at key structure points (HH, HL, LL, LH)
Visual reference for potential breakout/breakdown levels
Customizable colors for bullish and bearish breaks
Fibonacci Retracement
Auto-drawn between the last two pivots
Customizable levels: 0, 0.236, 0.382, 0.5, 0.618, 0.786, 1.0
Individual toggle and color settings for each level
Multi-Timeframe Dashboard
Displays trend status across 3 customizable timeframes
Shows trend direction: Bullish / Bearish / Neutral
Shows confirmation status: Confirmed / Unconfirmed
Color-coded for quick visual analysis
Trend Confirmation Logic (ICT/SMC Concepts)
Bullish Confirmed: HL followed by HH (Higher Low → Higher High pattern)
Bearish Confirmed: LH followed by LL (Lower High → Lower Low pattern)
Unconfirmed: Counter-structure appears (potential reversal signal)
🔹 SETTINGS
Swing Settings
Depth: Lookback period for pivot detection
Display
Toggle zigzag lines, labels, price on labels
Adjust label size and number of visible swings
Zigzag Settings
Line style: Solid, Dashed, Dotted
Thickness and colors for bullish/bearish trends
Swing Trendlines
Toggle high/low trendlines independently
Customizable colors, style, thickness
Option to extend trendlines
Structure Trendlines
Toggle HH→LH and LL→HL lines independently
Customizable colors, style, thickness
Option to extend trendlines
Break Levels
Toggle HH, HL, LL, LH break levels independently
Customizable colors for each level
Fibonacci
Toggle individual fib levels
Customizable colors and line style
Dashboard
Position: Top Left, Top Right, Bottom Left, Bottom Right
Size: Tiny, Small, Normal, Large
3 customizable timeframes
🔹 ALERTS
HH Broken: Price breaks above recent Higher High
HL Broken: Price breaks below recent Higher Low
LL Broken: Price breaks below recent Lower Low
LH Broken: Price breaks above recent Lower High
🔹 USE CASES
✅ Identify market structure and trend direction
✅ Spot potential trend reversals (unconfirmed status)
✅ Find key support/resistance levels
✅ Multi-timeframe trend alignment for trade confirmation
✅ Breakout/breakdown trading with break levels
✅ Fibonacci retracement entries
リリースノート
Swing elite Trend directionA comprehensive market structure indicator that identifies swing highs/lows, labels them with HH/HL/LH/LL structure, draws dynamic trendlines, and provides multi-timeframe trend analysis.
🔹 FEATURES
Market Structure Analysis
Automatically detects swing highs and swing lows
Labels each pivot with its structure type: HH (Higher High), HL (Higher Low), LH (Lower High), LL (Lower Low)
Color-coded zigzag lines based on confirmed trend direction
Structure Trendlines
Downtrend Line: Connects HH to LH (resistance in bearish structure)
Uptrend Line: Connects LL to HL (support in bullish structure)
Extended projection for potential future price interaction
Swing Trendlines
Connects the last 2 swing highs (resistance trendline)
Connects the last 2 swing lows (support trendline)
Optional extension to project future levels
Break Levels
Horizontal lines at key structure points (HH, HL, LL, LH)
Visual reference for potential breakout/breakdown levels
Customizable colors for bullish and bearish breaks
Fibonacci Retracement
Auto-drawn between the last two pivots
Customizable levels: 0, 0.236, 0.382, 0.5, 0.618, 0.786, 1.0
Individual toggle and color settings for each level
Multi-Timeframe Dashboard
Displays trend status across 3 customizable timeframes
Shows trend direction: Bullish / Bearish / Neutral
Shows confirmation status: Confirmed / Unconfirmed
Color-coded for quick visual analysis
Trend Confirmation Logic (ICT/SMC Concepts)
Bullish Confirmed: HL followed by HH (Higher Low → Higher High pattern)
Bearish Confirmed: LH followed by LL (Lower High → Lower Low pattern)
Unconfirmed: Counter-structure appears (potential reversal signal)
🔹 SETTINGS
Swing Settings
Depth: Lookback period for pivot detection
Display
Toggle zigzag lines, labels, price on labels
Adjust label size and number of visible swings
Zigzag Settings
Line style: Solid, Dashed, Dotted
Thickness and colors for bullish/bearish trends
Swing Trendlines
Toggle high/low trendlines independently
Customizable colors, style, thickness
Option to extend trendlines
Structure Trendlines
Toggle HH→LH and LL→HL lines independently
Customizable colors, style, thickness
Option to extend trendlines
Break Levels
Toggle HH, HL, LL, LH break levels independently
Customizable colors for each level
Fibonacci
Toggle individual fib levels
Customizable colors and line style
Dashboard
Position: Top Left, Top Right, Bottom Left, Bottom Right
Size: Tiny, Small, Normal, Large
3 customizable timeframes
🔹 ALERTS
HH Broken: Price breaks above recent Higher High
HL Broken: Price breaks below recent Higher Low
LL Broken: Price breaks below recent Lower Low
LH Broken: Price breaks above recent Lower High
🔹 USE CASES
✅ Identify market structure and trend direction
✅ Spot potential trend reversals (unconfirmed status)
✅ Find key support/resistance levels
✅ Multi-timeframe trend alignment for trade confirmation
✅ Breakout/breakdown trading with break levels
✅ Fibonacci retracement entries
3 hours ago
Release Notes
Swing elite Trend direction
A comprehensive market structure indicator that identifies swing highs/lows, labels them with HH/HL/LH/LL structure, draws dynamic trendlines, and provides multi-timeframe trend analysis.
🔹 FEATURES
Market Structure Analysis
Automatically detects swing highs and swing lows
Labels each pivot with its structure type: HH (Higher High), HL (Higher Low), LH (Lower High), LL (Lower Low)
Color-coded zigzag lines based on confirmed trend direction
Structure Trendlines
Downtrend Line: Connects HH to LH (resistance in bearish structure)
Uptrend Line: Connects LL to HL (support in bullish structure)
Extended projection for potential future price interaction
Swing Trendlines
Connects the last 2 swing highs (resistance trendline)
Connects the last 2 swing lows (support trendline)
Optional extension to project future levels
Break Levels
Horizontal lines at key structure points (HH, HL, LL, LH)
Visual reference for potential breakout/breakdown levels
Customizable colors for bullish and bearish breaks
Fibonacci Retracement
Auto-drawn between the last two pivots
Customizable levels: 0, 0.236, 0.382, 0.5, 0.618, 0.786, 1.0
Individual toggle and color settings for each level
Multi-Timeframe Dashboard
Displays trend status across 3 customizable timeframes
Shows trend direction: Bullish / Bearish / Neutral
Shows confirmation status: Confirmed / Unconfirmed
Color-coded for quick visual analysis
Trend Confirmation Logic (ICT/SMC Concepts)
Bullish Confirmed: HL followed by HH (Higher Low → Higher High pattern)
Bearish Confirmed: LH followed by LL (Lower High → Lower Low pattern)
Unconfirmed: Counter-structure appears (potential reversal signal)
🔹 SETTINGS
Swing Settings
Depth: Lookback period for pivot detection
Display
Toggle zigzag lines, labels, price on labels
Adjust label size and number of visible swings
Zigzag Settings
Line style: Solid, Dashed, Dotted
Thickness and colors for bullish/bearish trends
Swing Trendlines
Toggle high/low trendlines independently
Customizable colors, style, thickness
Option to extend trendlines
Structure Trendlines
Toggle HH→LH and LL→HL lines independently
Customizable colors, style, thickness
Option to extend trendlines
Break Levels
Toggle HH, HL, LL, LH break levels independently
Customizable colors for each level
Fibonacci
Toggle individual fib levels
Customizable colors and line style
Dashboard
Position: Top Left, Top Right, Bottom Left, Bottom Right
Size: Tiny, Small, Normal, Large
3 customizable timeframes
🔹 ALERTS
HH Broken: Price breaks above recent Higher High
HL Broken: Price breaks below recent Higher Low
LL Broken: Price breaks below recent Lower Low
LH Broken: Price breaks above recent Lower High
🔹 USE CASES
✅ Identify market structure and trend direction
✅ Spot potential trend reversals (unconfirmed status)
✅ Find key support/resistance levels
✅ Multi-timeframe trend alignment for trade confirmation
✅ Breakout/breakdown trading with break levels
✅ Fibonacci retracement entries
招待専用スクリプト
このスクリプトは作者が承認したユーザーのみアクセス可能です。使用するにはアクセス申請をして許可を得る必要があります。通常は支払い後に承認されます。詳細は下記の作者の指示に従うか、Swing_eliteに直接お問い合わせください。
TradingViewは、作者を完全に信頼し、スクリプトの動作を理解していない限り、有料スクリプトの購入・使用を推奨しません。コミュニティスクリプトには無料のオープンソースの代替が多数あります。
作者の指示
免責事項
この情報および投稿は、TradingViewが提供または推奨する金融、投資、トレード、その他のアドバイスや推奨を意図するものではなく、それらを構成するものでもありません。詳細は利用規約をご覧ください。