PROTECTED SOURCE SCRIPT
CVD with Divergences and Alerts (Subwindow)
This indicator calculates the Cumulative Volume Delta (CVD) to visualize buying and selling pressure, and automatically detects regular and hidden divergences between price and volume flow. It also includes optional alerts for real-time trade signal generation.
Core Logic:
• Cumulative Volume Delta (CVD):
Tracks the cumulative difference between buy and sell volume. Buy volume is defined as volume on bars where the close ≥ open; sell volume when close < open.
This reveals whether real participation supports price direction or not.
• Regular Divergences:
• Bullish Divergence: Price makes a lower low while CVD forms a higher low → potential upward reversal.
• Bearish Divergence: Price makes a higher high while CVD forms a lower high → potential downward reversal.
• Hidden Divergences:
• Hidden Bullish Divergence: Price pulls back to a lower low, but CVD shows strength with a higher high → possible continuation of an uptrend.
• Hidden Bearish Divergence: Price makes a higher high, but CVD weakens → possible continuation of a downtrend.
Features:
• Adjustable lookback period (default: 500 bars).
• Graphical visualization:
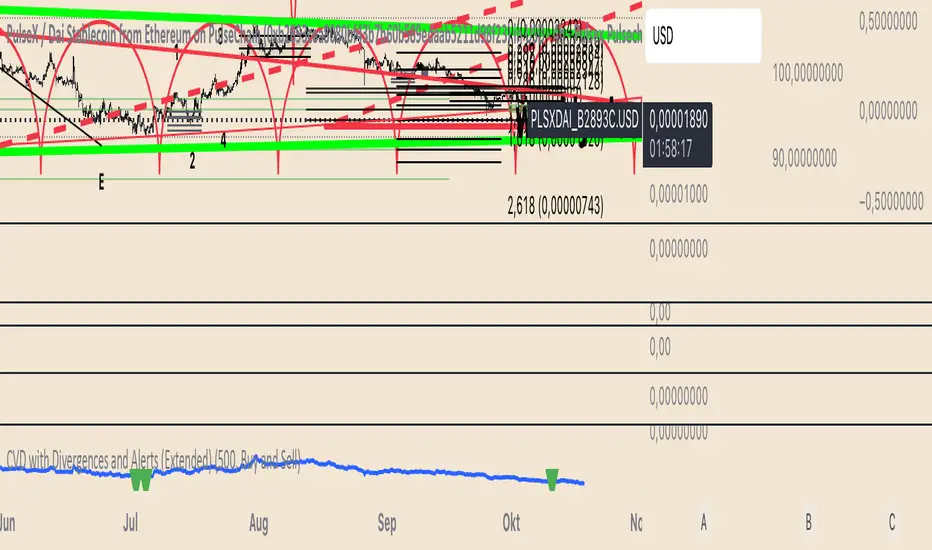
• Plots the CVD as a blue line in a separate panel.
• Marks divergences with green (bullish) and red (bearish) triangle shapes on the chart.
• Draws divergence lines between price and CVD for easy visual identification.
• Alerts:
• Configurable alert types (“Buy Only”, “Sell Only”, “Buy and Sell”).
• Sends alerts for all four divergence types (regular + hidden).
Usage:
Ideal for traders who want to detect shifts in volume momentum that precede price reversals or continuations. Works on all timeframes and instruments that provide volume data.
Core Logic:
• Cumulative Volume Delta (CVD):
Tracks the cumulative difference between buy and sell volume. Buy volume is defined as volume on bars where the close ≥ open; sell volume when close < open.
This reveals whether real participation supports price direction or not.
• Regular Divergences:
• Bullish Divergence: Price makes a lower low while CVD forms a higher low → potential upward reversal.
• Bearish Divergence: Price makes a higher high while CVD forms a lower high → potential downward reversal.
• Hidden Divergences:
• Hidden Bullish Divergence: Price pulls back to a lower low, but CVD shows strength with a higher high → possible continuation of an uptrend.
• Hidden Bearish Divergence: Price makes a higher high, but CVD weakens → possible continuation of a downtrend.
Features:
• Adjustable lookback period (default: 500 bars).
• Graphical visualization:
• Plots the CVD as a blue line in a separate panel.
• Marks divergences with green (bullish) and red (bearish) triangle shapes on the chart.
• Draws divergence lines between price and CVD for easy visual identification.
• Alerts:
• Configurable alert types (“Buy Only”, “Sell Only”, “Buy and Sell”).
• Sends alerts for all four divergence types (regular + hidden).
Usage:
Ideal for traders who want to detect shifts in volume momentum that precede price reversals or continuations. Works on all timeframes and instruments that provide volume data.
保護スクリプト
このスクリプトのソースコードは非公開で投稿されています。 しかし、無料かつ制限なしでご利用いただけます ― 詳細についてはこちらをご覧ください。
免責事項
これらの情報および投稿は、TradingViewが提供または保証する金融、投資、取引、またはその他の種類のアドバイスや推奨を意図したものではなく、またそのようなものでもありません。詳しくは利用規約をご覧ください。
免責事項
これらの情報および投稿は、TradingViewが提供または保証する金融、投資、取引、またはその他の種類のアドバイスや推奨を意図したものではなく、またそのようなものでもありません。詳しくは利用規約をご覧ください。