PROTECTED SOURCE SCRIPT
Litt Heat Map
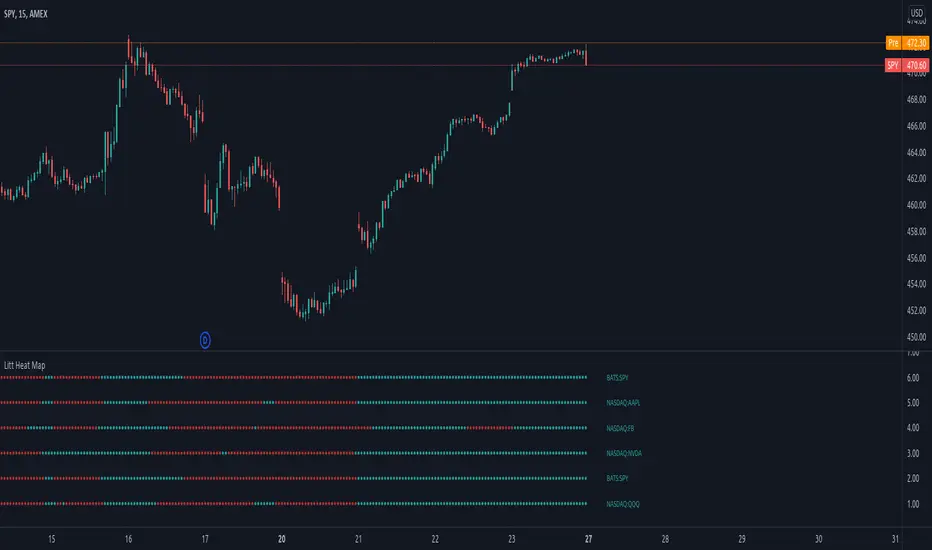
The Litt Heap Map uses the MA Line (Moving Average Line) from Litt Pro Indicators. The Heat Map tells the trader the trend direction based on MA 1 and MA 2.
If the value of MA 1 is greater than the value of MA 2 then the MA Line is colored Bull.
If the value of MA 1 is less than the value of MA 2 then the MA Line is colored Bear.
The Litt Heat Map allows you to see the MA Line for multiple symbols on 1 chart! You can use the Heat Map as a scanner to see when trend has changed, or as a trend confirmation tool when multiple symbols are aligning.
保護スクリプト
このスクリプトのソースコードは非公開で投稿されています。 ただし、制限なく自由に使用できます – 詳細はこちらでご確認ください。
免責事項
この情報および投稿は、TradingViewが提供または推奨する金融、投資、トレード、その他のアドバイスや推奨を意図するものではなく、それらを構成するものでもありません。詳細は利用規約をご覧ください。
免責事項
この情報および投稿は、TradingViewが提供または推奨する金融、投資、トレード、その他のアドバイスや推奨を意図するものではなく、それらを構成するものでもありません。詳細は利用規約をご覧ください。