PROTECTED SOURCE SCRIPT
更新済 ADX + DI + EMA Dashboard (BKNY)
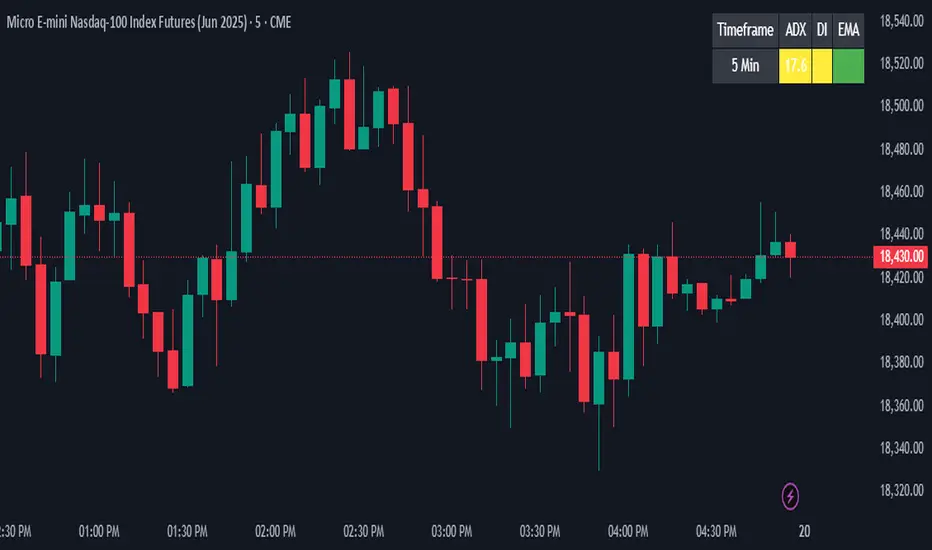
This Indicator creates a dynamic dashboard that combines ADX (Average Directional Index), Directional Movement Index (DI), and Exponential Moving Averages (EMA) to provide a comprehensive view of market trends. The indicator helps traders assess the strength and direction of trends based on key technical indicators.
Features:
ADX: Measures the strength of the trend, allowing traders to identify whether a trend is strong or weak.
+DI and -DI: Show the bullish and bearish directional movements, helping to identify market direction.
EMA Crossover: Compares the fast and slow EMAs to determine the trend’s direction.
Customizable Features:
Adjust the calculation length for ADX, DI, and EMAs.
Set ADX and DI thresholds to define trend strength and direction.
EMA lengths are fully customizable for both fast and slow EMAs.
Display options allow users to show or hide ADX, DI, and EMA values on the dashboard.
Customize the colors to represent bullish, bearish, or neutral trend conditions for ADX, DI, and EMA.
Timeframe selection allows users to choose the preferred timeframe for trend analysis.
The dashboard layout and display are fully customizable, letting users tailor the information shown according to their trading preferences.
This script provides an at-a-glance view of key trend indicators, with flexibility to tailor both the data shown and the visual presentation to individual trading needs.
リリースノート
This Indicator creates a dynamic dashboard that combines ADX (Average Directional Index), Directional Movement Index (DI), and Exponential Moving Averages (EMA) to provide a comprehensive view of market trends. The indicator helps traders assess the strength and direction of trends based on key technical indicators.Features:
ADX: Measures the strength of the trend, allowing traders to identify whether a trend is strong or weak.
+DI and -DI: Show the bullish and bearish directional movements, helping to identify market direction.
EMA Crossover: Compares the fast and slow EMAs to determine the trend’s direction.
Customizable Features:
Adjust the calculation length for ADX, DI, and EMAs.
Set ADX and DI thresholds to define trend strength and direction.
EMA lengths are fully customizable for both fast and slow EMAs.
Display options allow users to show or hide ADX, DI, and EMA values on the dashboard.
Customize the colors to represent bullish, bearish, or neutral trend conditions for ADX, DI, and EMA.
Timeframe selection allows users to choose the preferred timeframe for trend analysis.
The dashboard layout and display are fully customizable, letting users tailor the information shown according to their trading preferences.
This script provides an at-a-glance view of key trend indicators, with flexibility to tailor both the data shown and the visual presentation to individual trading needs.
1 hour ago
Release Notes
This Indicator creates a dynamic dashboard that combines ADX (Average Directional Index), Directional Movement Index (DI), and Exponential Moving Averages (EMA) to provide a comprehensive view of market trends. The indicator helps traders assess the strength and direction of trends based on key technical indicators.
Features:
ADX: Measures the strength of the trend, allowing traders to identify whether a trend is strong or weak.
+DI and -DI: Show the bullish and bearish directional movements, helping to identify market direction.
EMA Crossover: Compares the fast and slow EMAs to determine the trend’s direction.
Customizable Features:
Adjust the calculation length for ADX, DI, and EMAs.
Set ADX and DI thresholds to define trend strength and direction.
EMA lengths are fully customizable for both fast and slow EMAs.
Display options allow users to show or hide ADX, DI, and EMA values on the dashboard.
Customize the colors to represent bullish, bearish, or neutral trend conditions for ADX, DI, and EMA.
Timeframe selection allows users to choose the preferred timeframe for trend analysis.
The dashboard layout and display are fully customizable, letting users tailor the information shown according to their trading preferences.
This script provides an at-a-glance view of key trend indicators, with flexibility to tailor both the data shown and the visual presentation to individual trading needs.
リリースノート
Increased precision of calculated values保護スクリプト
このスクリプトのソースコードは非公開で投稿されています。 ただし、制限なく自由に使用できます – 詳細はこちらでご確認ください。
免責事項
この情報および投稿は、TradingViewが提供または推奨する金融、投資、トレード、その他のアドバイスや推奨を意図するものではなく、それらを構成するものでもありません。詳細は利用規約をご覧ください。
免責事項
この情報および投稿は、TradingViewが提供または推奨する金融、投資、トレード、その他のアドバイスや推奨を意図するものではなく、それらを構成するものでもありません。詳細は利用規約をご覧ください。