INVITE-ONLY SCRIPT
更新済 Signals & Overlays [UAlgo]
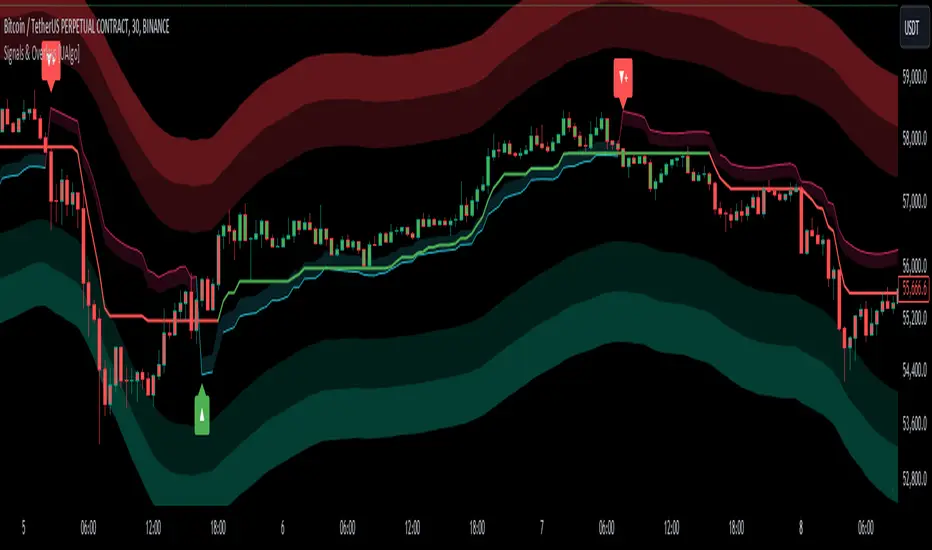
The Signals & Overlays [UAlgo] indicator is a comprehensive trading tool designed to provide traders with a holistic view of market conditions. It combines multiple analysis techniques to offer insights into trend direction, potential reversal points, and optimal entry and exit levels. This versatile indicator is suitable for various trading styles and timeframes, also has Beginner-Friendly presets to enable multiple features at once within one-click.

🔶 Key Features:
🔹 Contrarian Signals:
This feature identifies potential trend reversals and market turning points. These contrarian signals are displayed as arrow markers on the chart, alerting traders to possible opportunities that go against the prevailing trend. The signals are based on a combination of price action, momentum, and volatility factors, providing a multi-faceted approach to market analysis.


Customizable Settings :
Signal Sensitivity: Adjustable from 0.1 to 10.0. This controls how sensitive the indicator is to potential reversal signals.
🔹 Reversal Zones:
This feature utilizes statistical methods that compute a smoothed average and associated bands around a data series using Gaussian weights. The Gaussian distribution helps to assign more weight to data points near the center of the window, and the bands represent the average plus/minus a scaled measure of deviation.
This technique is often used in financial analysis to detect trends and measure volatility to identify key areas where price reversals are more likely to occur. These zones providing a dynamic representation of potential support and resistance areas. Traders can use these zones to anticipate potential price reactions and plan their entries and exits accordingly.

Users can also customize the responsiveness of the Reversal Zones through the "Zone Speed" setting. This allows for fine-tuning the model's sensitivity to price changes:
Swift Mode: Quickly adapts to recent price movements, ideal for short-term trading.

Standard Mode: Balances recent and historical data for a medium-term perspective.

Slow Mode: Emphasizes longer-term trends, suitable for position trading.

Customizable Settings :
Zone Data Source: Users can select which price data (open, high, low, close, etc.) to use for zone calculations.
Zone Speed: Choosable between "Swift", "Standard", and "Slow", affecting how quickly the zones adapt to price changes.
🔹 Smart Trail:
The Smart Trail feature provides an adaptive trend-following mechanism. It plots a dynamic line that adjusts based on price action and volatility, helping traders stay in trending moves while providing a trailing stop-loss reference. This feature is particularly useful for managing open positions and optimizing exit points.

🔹 Trend Cloud:
Generates a specialized trend indicator using double-smoothed EMAs applied to closing prices and the high-low price range. It visualizes market trends and volatility by shading the area between different indicator values over time. The color of the shading changes to reflect whether the current trend is strengthening or weakening.
The Trend Cloud feature provides a visually intuitive representation of the overall market trend. It generates a dynamic colored cloud on the chart that helps traders quickly assess the current market direction and strength. Bullish trends represented by blue clouds and bearish trends by red clouds.

🔹 Trend Analyzer:
The Trend Analyzer component provides an in-depth analysis of the current market trend. It uses a customizable moving average system to determine the trend direction and strength. The analyzer can be configured to focus on short-term, medium-term, or long-term trends, allowing traders to align their strategy with their preferred trading timeframe.

Customizable Settings :
Analyzer Calculation Period: Adjustable period for trend analysis calculations.
Analyzer Mode: Selectable between "Short-Term", "Medium-Term", and "Long-Term".
Analyzer Calculation Source: Customizable price data source for trend analysis.
Use Heikin Ashi: Option to use Heikin Ashi candles instead of regular candles for calculations.
🔹 TP/Exit/Entry Levels:
The indicator calculates and displays potential take profit (TP), exit, and entry levels based on market structure and volatility. These levels are marked on the chart, offering traders guidance on optimal points for trade management. This feature can be particularly helpful for setting profit targets and managing risk.

🔹 Dashboard:
The customizable dashboard provides a quick overview of key market metrics. It displays information such as trend strength, volume analysis, market volatility, the current state of the Trend Catcher and the market is "Bearish" or "Bullish". This at-a-glance summary helps traders make informed decisions without the need to switch between multiple indicators.

Customizable Settings :
Toggle: Option to display or hide the dashboard.
Dashboard Position and Size: Selectable between "Top Right", "Bottom Right", and "Bottom Left". Adjustable size to "Tiny", "Small" or "Normal".
🔶 Disclaimer:
Use with Caution: This indicator is provided for educational and informational purposes only and should not be considered as financial advice. Users should exercise caution and perform their own analysis before making trading decisions based on the indicator's signals.
Not Financial Advice: The information provided by this indicator does not constitute financial advice, and the creator (UAlgo) shall not be held responsible for any trading losses incurred as a result of using this indicator.
Backtesting Recommended: Traders are encouraged to backtest the indicator thoroughly on historical data before using it in live trading to assess its performance and suitability for their trading strategies.
Risk Management: Trading involves inherent risks, and users should implement proper risk management strategies, including but not limited to stop-loss orders and position sizing, to mitigate potential losses.
No Guarantees: The accuracy and reliability of the indicator's signals cannot be guaranteed, as they are based on historical price data and past performance may not be indicative of future results.
🔶 Key Features:
🔹 Contrarian Signals:
This feature identifies potential trend reversals and market turning points. These contrarian signals are displayed as arrow markers on the chart, alerting traders to possible opportunities that go against the prevailing trend. The signals are based on a combination of price action, momentum, and volatility factors, providing a multi-faceted approach to market analysis.
Customizable Settings :
Signal Sensitivity: Adjustable from 0.1 to 10.0. This controls how sensitive the indicator is to potential reversal signals.
🔹 Reversal Zones:
This feature utilizes statistical methods that compute a smoothed average and associated bands around a data series using Gaussian weights. The Gaussian distribution helps to assign more weight to data points near the center of the window, and the bands represent the average plus/minus a scaled measure of deviation.
This technique is often used in financial analysis to detect trends and measure volatility to identify key areas where price reversals are more likely to occur. These zones providing a dynamic representation of potential support and resistance areas. Traders can use these zones to anticipate potential price reactions and plan their entries and exits accordingly.
Users can also customize the responsiveness of the Reversal Zones through the "Zone Speed" setting. This allows for fine-tuning the model's sensitivity to price changes:
Swift Mode: Quickly adapts to recent price movements, ideal for short-term trading.
Standard Mode: Balances recent and historical data for a medium-term perspective.
Slow Mode: Emphasizes longer-term trends, suitable for position trading.
Customizable Settings :
Zone Data Source: Users can select which price data (open, high, low, close, etc.) to use for zone calculations.
Zone Speed: Choosable between "Swift", "Standard", and "Slow", affecting how quickly the zones adapt to price changes.
🔹 Smart Trail:
The Smart Trail feature provides an adaptive trend-following mechanism. It plots a dynamic line that adjusts based on price action and volatility, helping traders stay in trending moves while providing a trailing stop-loss reference. This feature is particularly useful for managing open positions and optimizing exit points.
🔹 Trend Cloud:
Generates a specialized trend indicator using double-smoothed EMAs applied to closing prices and the high-low price range. It visualizes market trends and volatility by shading the area between different indicator values over time. The color of the shading changes to reflect whether the current trend is strengthening or weakening.
The Trend Cloud feature provides a visually intuitive representation of the overall market trend. It generates a dynamic colored cloud on the chart that helps traders quickly assess the current market direction and strength. Bullish trends represented by blue clouds and bearish trends by red clouds.
🔹 Trend Analyzer:
The Trend Analyzer component provides an in-depth analysis of the current market trend. It uses a customizable moving average system to determine the trend direction and strength. The analyzer can be configured to focus on short-term, medium-term, or long-term trends, allowing traders to align their strategy with their preferred trading timeframe.
Customizable Settings :
Analyzer Calculation Period: Adjustable period for trend analysis calculations.
Analyzer Mode: Selectable between "Short-Term", "Medium-Term", and "Long-Term".
Analyzer Calculation Source: Customizable price data source for trend analysis.
Use Heikin Ashi: Option to use Heikin Ashi candles instead of regular candles for calculations.
🔹 TP/Exit/Entry Levels:
The indicator calculates and displays potential take profit (TP), exit, and entry levels based on market structure and volatility. These levels are marked on the chart, offering traders guidance on optimal points for trade management. This feature can be particularly helpful for setting profit targets and managing risk.
🔹 Dashboard:
The customizable dashboard provides a quick overview of key market metrics. It displays information such as trend strength, volume analysis, market volatility, the current state of the Trend Catcher and the market is "Bearish" or "Bullish". This at-a-glance summary helps traders make informed decisions without the need to switch between multiple indicators.
Customizable Settings :
Toggle: Option to display or hide the dashboard.
Dashboard Position and Size: Selectable between "Top Right", "Bottom Right", and "Bottom Left". Adjustable size to "Tiny", "Small" or "Normal".
🔶 Disclaimer:
Use with Caution: This indicator is provided for educational and informational purposes only and should not be considered as financial advice. Users should exercise caution and perform their own analysis before making trading decisions based on the indicator's signals.
Not Financial Advice: The information provided by this indicator does not constitute financial advice, and the creator (UAlgo) shall not be held responsible for any trading losses incurred as a result of using this indicator.
Backtesting Recommended: Traders are encouraged to backtest the indicator thoroughly on historical data before using it in live trading to assess its performance and suitability for their trading strategies.
Risk Management: Trading involves inherent risks, and users should implement proper risk management strategies, including but not limited to stop-loss orders and position sizing, to mitigate potential losses.
No Guarantees: The accuracy and reliability of the indicator's signals cannot be guaranteed, as they are based on historical price data and past performance may not be indicative of future results.
リリースノート
Alerts added.リリースノート
Improved Take Profit/Entry/Exit Marks Logic.Reversal bands became more sensitive.
招待専用スクリプト
このスクリプトは作者が承認したユーザーのみアクセス可能です。使用するにはアクセス申請をして許可を得る必要があります。通常は支払い後に承認されます。詳細は下記の作者の指示に従うか、UAlgoに直接お問い合わせください。
TradingViewは、作者を完全に信頼し、スクリプトの動作を理解していない限り、有料スクリプトの購入・使用を推奨しません。コミュニティスクリプトには無料のオープンソースの代替が多数あります。
作者の指示
Get instant access here: https://ualgo.trade/
免責事項
この情報および投稿は、TradingViewが提供または推奨する金融、投資、トレード、その他のアドバイスや推奨を意図するものではなく、それらを構成するものでもありません。詳細は利用規約をご覧ください。