PROTECTED SOURCE SCRIPT
更新済 MDTANOS EMA Spread Indicator [v2018-09-01]
Built an indicator providing buy / sell signals for MDTANOS from the
ProfitTrailer discord discord.gg/K9a37Vh as an educational exercise to
show him and the rest of the profit trailer community how to create an indicator
on TradingView using PineScript.
He requested:
i would like to know how to see on tradingview a combination of EMASPREADS
on 5 min and 15 min time frame is it possible?
i have a buy strategy from A to D that combines several time frames
all using EMASPREAD
and the bot buys when all them are true
each of them uses a different time frame
5 min, 15 min, 30 min, 1hour 2 hours 4 hours and 1 day
is there a way to visualize thid condition on tradingview?
Rather than build directly to the requested strategy I made this a
generic and more flexible indicator that can be used and configured
to work on any market, timeframe and trading pair.
Note it is using the timeframes defined for the CandlePeriod parameter
rather than the chart resolution.
I first published the basis of this indicator on the ProfitTrailer discord.
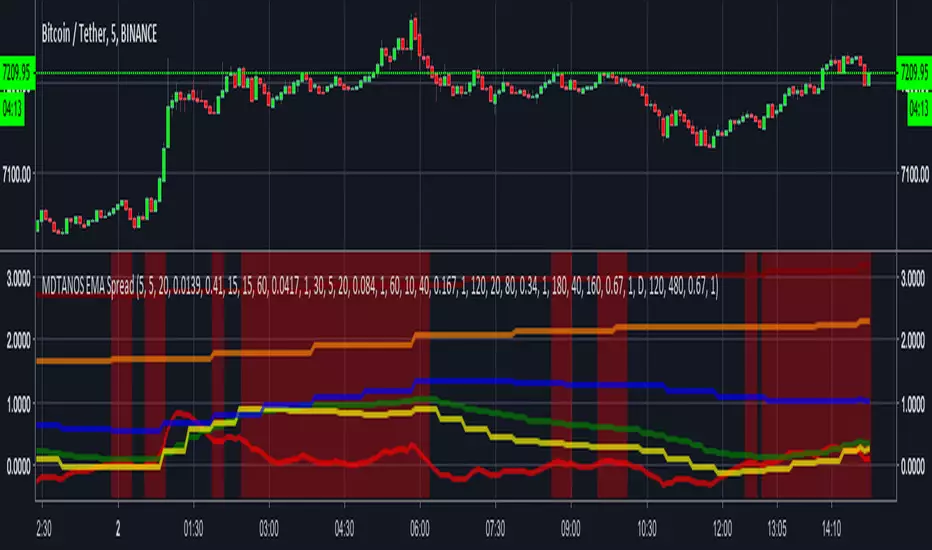
The script uses an EMA spread as its main signal and displays the
spread values as lines on the indicator based on whatever input
criteria you provide.
Based on the buy value and buy limit values it works out buy signals.
The display of the buy signals is optional as displaying them altogether
would not be particularly useful.
This software is provided under a commercial license that grants
personal use only, please refer:
github.com/cryptocoyns/tradingviewscripts/license
Copyright (c) 2018, Grant Cause aka CryptoCoyn
ProfitTrailer discord discord.gg/K9a37Vh as an educational exercise to
show him and the rest of the profit trailer community how to create an indicator
on TradingView using PineScript.
He requested:
i would like to know how to see on tradingview a combination of EMASPREADS
on 5 min and 15 min time frame is it possible?
i have a buy strategy from A to D that combines several time frames
all using EMASPREAD
and the bot buys when all them are true
each of them uses a different time frame
5 min, 15 min, 30 min, 1hour 2 hours 4 hours and 1 day
is there a way to visualize thid condition on tradingview?
Rather than build directly to the requested strategy I made this a
generic and more flexible indicator that can be used and configured
to work on any market, timeframe and trading pair.
Note it is using the timeframes defined for the CandlePeriod parameter
rather than the chart resolution.
I first published the basis of this indicator on the ProfitTrailer discord.
The script uses an EMA spread as its main signal and displays the
spread values as lines on the indicator based on whatever input
criteria you provide.
Based on the buy value and buy limit values it works out buy signals.
The display of the buy signals is optional as displaying them altogether
would not be particularly useful.
This software is provided under a commercial license that grants
personal use only, please refer:
github.com/cryptocoyns/tradingviewscripts/license
Copyright (c) 2018, Grant Cause aka CryptoCoyn
リリースノート
Please note: This indicator is no longer available for use.保護スクリプト
このスクリプトのソースコードは非公開で投稿されています。 ただし、制限なく自由に使用できます – 詳細はこちらでご確認ください。
免責事項
この情報および投稿は、TradingViewが提供または推奨する金融、投資、トレード、その他のアドバイスや推奨を意図するものではなく、それらを構成するものでもありません。詳細は利用規約をご覧ください。
保護スクリプト
このスクリプトのソースコードは非公開で投稿されています。 ただし、制限なく自由に使用できます – 詳細はこちらでご確認ください。
免責事項
この情報および投稿は、TradingViewが提供または推奨する金融、投資、トレード、その他のアドバイスや推奨を意図するものではなく、それらを構成するものでもありません。詳細は利用規約をご覧ください。