INVITE-ONLY SCRIPT
Custom Fibonacci Support & Resistance Lines
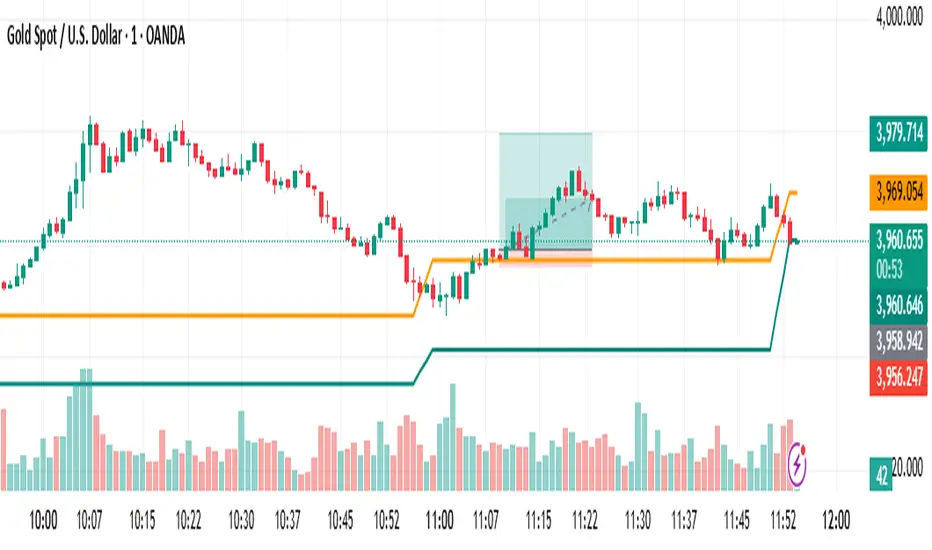
Custom Fibonacci Support & Resistance Lines automatically plots dynamic 0.618-style Fibonacci levels based on recent swing highs and lows.
The script detects the latest confirmed swing high and swing low on the chart and calculates two adaptive lines:
A Fibonacci Support Line below price (retracement from swing high to swing low).
A Fibonacci Resistance Line above price (retracement from swing low to swing high).
Both levels are smoothed using a simple moving average for a cleaner visual appearance — similar to an adaptive support/resistance band that follows recent market structure.
⚙️ Features
🔹 Auto-detects swing highs & lows using left/right bar pivots.
🔹 Adjustable Fibonacci levels for both Support and Resistance.
🔹 Adjustable smoothing length for smoother or more reactive lines.
🔹 Works across any timeframe and instrument.
🔹 Ideal for spotting potential reversal zones, trend continuation areas, and dynamic price support/resistance.
🧮 Default Settings
Fibonacci Level (Support) = 0.618
Fibonacci Level (Resistance) = 0.618
Left/Right Swing Bars = 5 / 5
Smoothing Length = 3
💡 Usage Tips
Combine these dynamic Fibonacci lines with trend indicators (EMA, RSI, or structure breaks) to confirm entries.
Increase Left/Right Swing Bars for stronger structural pivots on higher timeframes.
Change Fibonacci Levels (e.g., 0.382, 0.5, 0.786) to visualize multiple retracement zones.
招待専用スクリプト
こちらのスクリプトにアクセスできるのは投稿者が承認したユーザーだけです。投稿者にリクエストして使用許可を得る必要があります。通常の場合、支払い後に許可されます。詳細については、以下、作者の指示をお読みになるか、ChartTechnicalに直接ご連絡ください。
スクリプトの機能を理解し、その作者を全面的に信頼しているのでなければ、お金を支払ってまでそのスクリプトを利用することをTradingViewとしては「非推奨」としています。コミュニティスクリプトの中で、その代わりとなる無料かつオープンソースのスクリプトを見つけられる可能性もあります。
作者の指示
drop a message to me
免責事項
これらの情報および投稿は、TradingViewが提供または保証する金融、投資、取引、またはその他の種類のアドバイスや推奨を意図したものではなく、またそのようなものでもありません。詳しくは利用規約をご覧ください。