PROTECTED SOURCE SCRIPT
更新済 Higher High Lower Low - Live

Hello All!
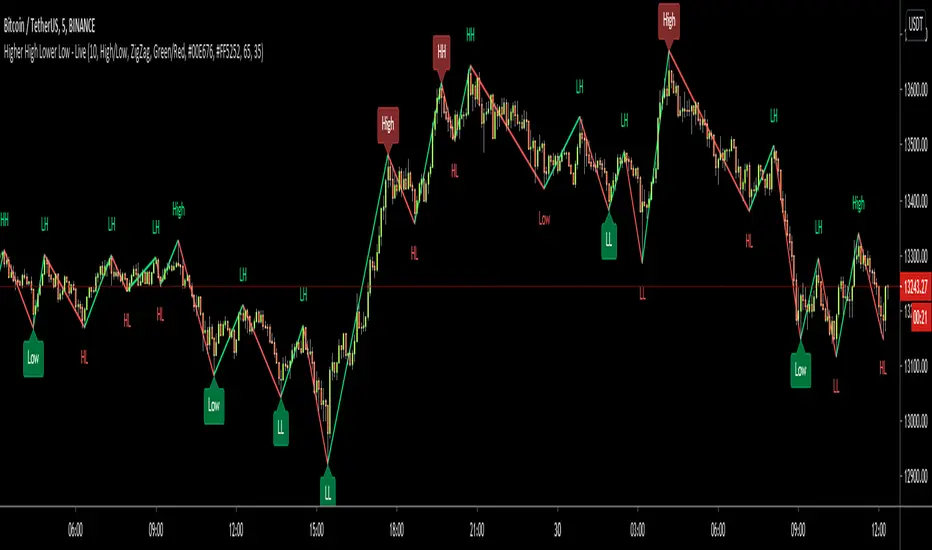
This is Higher High Lower Low - Live script. HHLL Live means Labels are calculated and placed dynamically. if you don't know what the Higher High - Lower Low is then you should search it on the net ;)
This is not Buy/Sell indicator but you can use it to analyse the trend or you can use it with other indicators to get signals and confirmation. You have option to use High/Low or Open/Close prices.
The script checks some indicators to see if it's in OB/OS levels and if they are in OB/OS levels then label colors are changed optionally. default OB level = 65, OS level = 35. you can set them as you wish.
I felt I need to protect the source code of the script, so this time it's not open-source.
Before you asked I should answer; it's non-repainting, live and dynamic script, you can use this with all time frames and any pair, indices, stocks etc ;)
You have option to get support/resistance levels and option to change bar color according to the trend that is calculated using broken S/R levels.

You can use different colors:

You can use Close/Open prices as source:

You have option to see only HH LL labels:

Enjoy and Good luck!
This is Higher High Lower Low - Live script. HHLL Live means Labels are calculated and placed dynamically. if you don't know what the Higher High - Lower Low is then you should search it on the net ;)
This is not Buy/Sell indicator but you can use it to analyse the trend or you can use it with other indicators to get signals and confirmation. You have option to use High/Low or Open/Close prices.
The script checks some indicators to see if it's in OB/OS levels and if they are in OB/OS levels then label colors are changed optionally. default OB level = 65, OS level = 35. you can set them as you wish.
I felt I need to protect the source code of the script, so this time it's not open-source.
Before you asked I should answer; it's non-repainting, live and dynamic script, you can use this with all time frames and any pair, indices, stocks etc ;)
You have option to get support/resistance levels and option to change bar color according to the trend that is calculated using broken S/R levels.
You can use different colors:
You can use Close/Open prices as source:
You have option to see only HH LL labels:
Enjoy and Good luck!
リリースノート
Alerts added for:- New High
- New Low
- Higher High
- Higher Low
- Lower High
- Lower Low
and
- New High and Overbought
- Higher High and Overbought
- Lower High and Overbought
and
- New Low and Oversold
- Higher Low and Oversold
- Lower Low and Oversold
Enjoy!
保護スクリプト
このスクリプトのソースコードは非公開で投稿されています。 ただし、制限なく自由に使用できます – 詳細はこちらでご確認ください。
Our New Free Official Telegram Channel is t.me/+nOh3yWZOYINlOWIy
免責事項
この情報および投稿は、TradingViewが提供または推奨する金融、投資、トレード、その他のアドバイスや推奨を意図するものではなく、それらを構成するものでもありません。詳細は利用規約をご覧ください。
保護スクリプト
このスクリプトのソースコードは非公開で投稿されています。 ただし、制限なく自由に使用できます – 詳細はこちらでご確認ください。
Our New Free Official Telegram Channel is t.me/+nOh3yWZOYINlOWIy
免責事項
この情報および投稿は、TradingViewが提供または推奨する金融、投資、トレード、その他のアドバイスや推奨を意図するものではなく、それらを構成するものでもありません。詳細は利用規約をご覧ください。