OPEN-SOURCE SCRIPT
RSI Divergence Tops + Bottoms
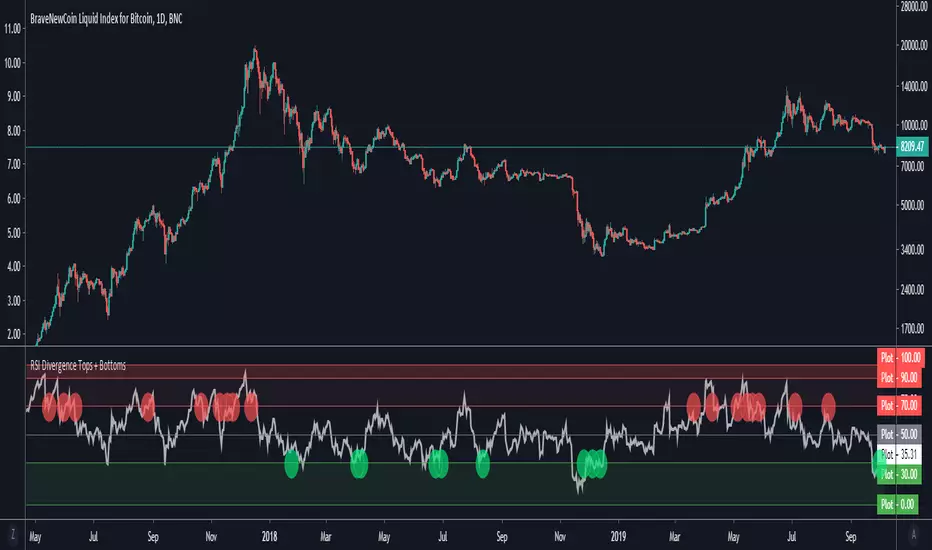
RSI Indicator which plots local peaks and troughs in divergence.
Divergence is specified as:
- A higher price, with reduced RSI --> Potential Sell Point
- A lower price, with higher RSI --> Potential Buy Point
RSI Divergence should be used in combination with other indicators. This indicator identifies local tops and bottoms, with potential for macro trend shifts.
Read more about trading RSI Divergence on Investopedia here: investopedia.com/trading/trading-divergence-and-understanding-momentum/
オープンソーススクリプト
TradingViewの精神に則り、このスクリプトの作者はコードをオープンソースとして公開してくれました。トレーダーが内容を確認・検証できるようにという配慮です。作者に拍手を送りましょう!無料で利用できますが、コードの再公開はハウスルールに従う必要があります。
免責事項
この情報および投稿は、TradingViewが提供または推奨する金融、投資、トレード、その他のアドバイスや推奨を意図するものではなく、それらを構成するものでもありません。詳細は利用規約をご覧ください。
オープンソーススクリプト
TradingViewの精神に則り、このスクリプトの作者はコードをオープンソースとして公開してくれました。トレーダーが内容を確認・検証できるようにという配慮です。作者に拍手を送りましょう!無料で利用できますが、コードの再公開はハウスルールに従う必要があります。
免責事項
この情報および投稿は、TradingViewが提供または推奨する金融、投資、トレード、その他のアドバイスや推奨を意図するものではなく、それらを構成するものでもありません。詳細は利用規約をご覧ください。