PROTECTED SOURCE SCRIPT
更新済 Distribution Quarter Indicator
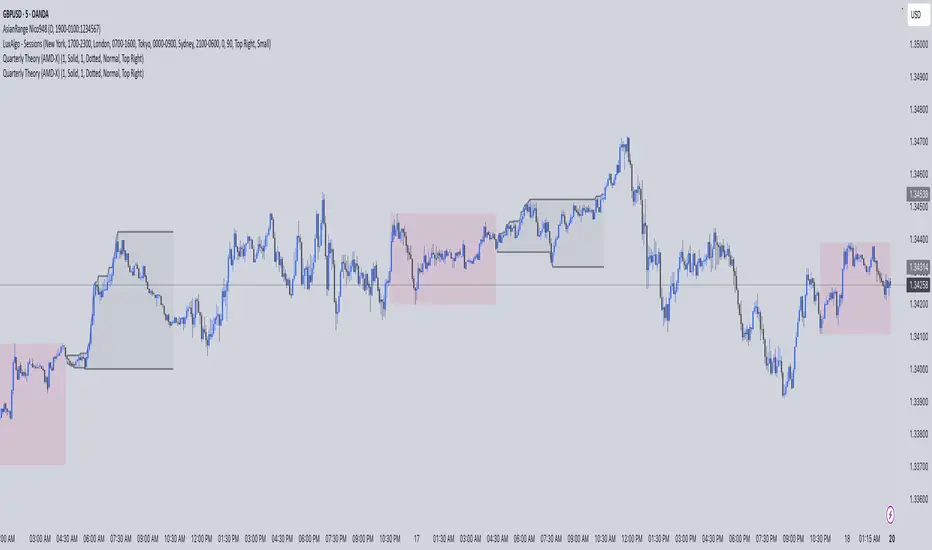
This indicator automatically draws vertical lines at the two most important distribution quarter times in the trading day:
6:00 AM NY time (Market preparation phase)
12:00 PM NY time (Midday distribution period)
Key Features:
✅ Automatic time detection - Uses NY timezone (UTC-4) for accurate timing
✅ Fully customizable lines - Choose between solid, dotted, or dashed styles
✅ Adjustable line width - Set thickness from 1-5 pixels
✅ Custom colors - Individual color settings for each time marker
✅ Optional labels - Toggle time labels on/off
✅ Historical coverage - Lines appear on all past and future data
Perfect For:
Day traders tracking distribution patterns
Scalpers identifying key time-based levels
Anyone analyzing intraday market structure around quarter periods
How to Use:
Customize line styles and colors in settings
Lines will automatically appear at the specified NY times
Use as reference points for distribution analysis
リリースノート
Distribution Quarter IndicatorMark key distribution times with vertical lines at 6:00 AM and 12:00 PM NY time
Features:
Flexible timeframes - Choose 1m, 5m, 15m, 30m, 1H, 4H (15m default)
Future lines - Shows next upcoming quarter times
Customizable - Line style, width, colors, labels
Historical data - Lines on all past candles
Perfect for:
Day traders tracking distribution patterns
Planning entries around key NY session times
Market structure analysis
Setup:
Select timeframes with checkboxes
Customize line appearance in settings
Lines automatically appear at 6:00 AM and 12:00 PM NY time
Simple, clean, and effective for distribution quarter analysis.
リリースノート
V2保護スクリプト
このスクリプトのソースコードは非公開で投稿されています。 ただし、制限なく自由に使用できます – 詳細はこちらでご確認ください。
免責事項
この情報および投稿は、TradingViewが提供または推奨する金融、投資、トレード、その他のアドバイスや推奨を意図するものではなく、それらを構成するものでもありません。詳細は利用規約をご覧ください。
免責事項
この情報および投稿は、TradingViewが提供または推奨する金融、投資、トレード、その他のアドバイスや推奨を意図するものではなく、それらを構成するものでもありません。詳細は利用規約をご覧ください。