PROTECTED SOURCE SCRIPT
Intraday Zones & Levels - Support & Resistance
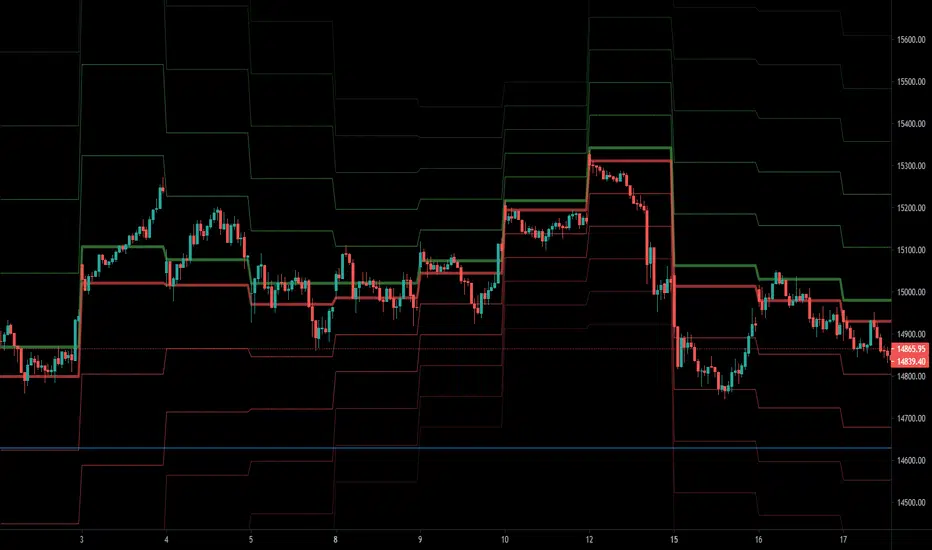
I use this indicator to mark levels and mathematically categorize my 15mins chart into smaller trading zones. You can view these as Support and Resistance levels as well, however, the main function is to visually divide the chart on the basis of previous days' price movements.
- Levels are calculated based on the Average % Change per Day for the last 5 Days. Calculations use Daily open Value for the last 5 days & % Change using current open Value.
- Entry Levels ( Bullish and Bearish ) mathematically divide the charts into 2 zones and can be used to determine the nature of the stock movement during that day.
- Weekly and Yearly Open Prices are also plotted on the chart as reference levels.
保護スクリプト
このスクリプトのソースコードは非公開で投稿されています。 ただし、制限なく自由に使用できます – 詳細はこちらでご確認ください。
-
Garey
Whatsapp - +91 9999 504 500
Garey
Whatsapp - +91 9999 504 500
免責事項
この情報および投稿は、TradingViewが提供または推奨する金融、投資、トレード、その他のアドバイスや推奨を意図するものではなく、それらを構成するものでもありません。詳細は利用規約をご覧ください。
保護スクリプト
このスクリプトのソースコードは非公開で投稿されています。 ただし、制限なく自由に使用できます – 詳細はこちらでご確認ください。
-
Garey
Whatsapp - +91 9999 504 500
Garey
Whatsapp - +91 9999 504 500
免責事項
この情報および投稿は、TradingViewが提供または推奨する金融、投資、トレード、その他のアドバイスや推奨を意図するものではなく、それらを構成するものでもありません。詳細は利用規約をご覧ください。