PROTECTED SOURCE SCRIPT
MA Distance Indicator
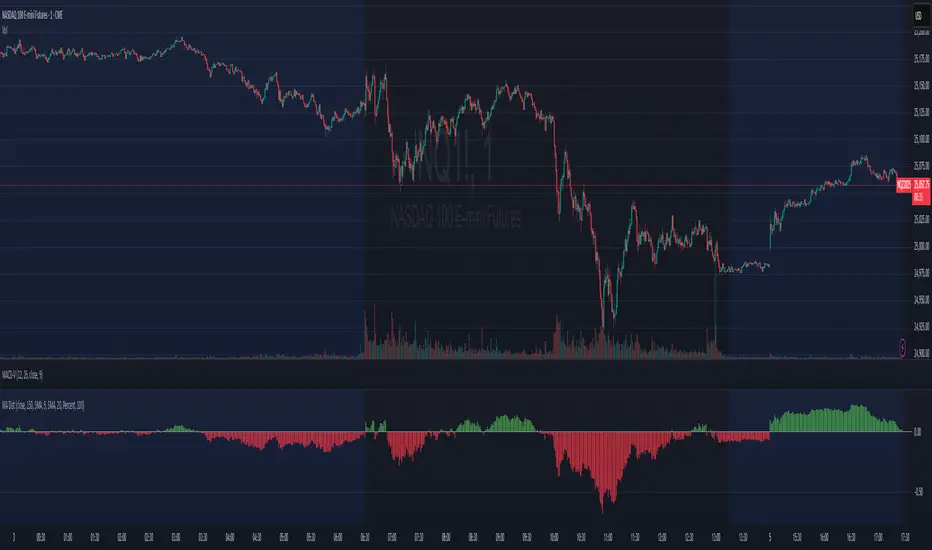
The distance from a moving average is a common way to look at how extended a stock is. This simplifies it a bit by plotting the distance below the chart, so you don't have to eyeball estimate it.
This indicator allows plotting the distance from 2 MAs, one is a histogram and one is a line.
The line MA is off by default.
The scale factor is in case you are using it intraday, it helps with small multiples of the Moving Average that would be common intraday.
"Scale by" lets you decide if the distance is measured as a percentage of the moving average level or as a count of ATRs.
保護スクリプト
このスクリプトのソースコードは非公開で投稿されています。 ただし、制限なく自由に使用できます – 詳細はこちらでご確認ください。
免責事項
この情報および投稿は、TradingViewが提供または推奨する金融、投資、トレード、その他のアドバイスや推奨を意図するものではなく、それらを構成するものでもありません。詳細は利用規約をご覧ください。
免責事項
この情報および投稿は、TradingViewが提供または推奨する金融、投資、トレード、その他のアドバイスや推奨を意図するものではなく、それらを構成するものでもありません。詳細は利用規約をご覧ください。