OPEN-SOURCE SCRIPT
change in rsi
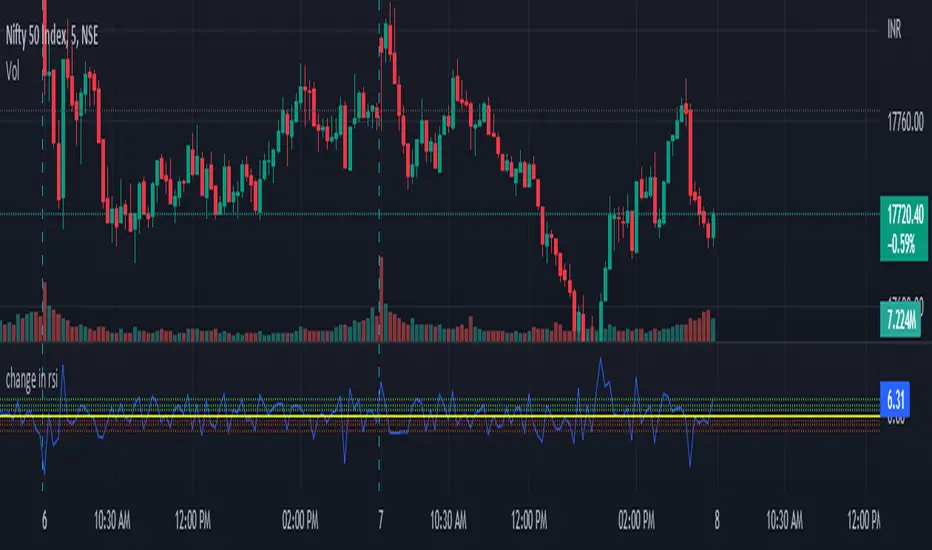
This indicator will show how fast the rsi of a symbol is changing. you can see this as a differentiation function on rsi .
this will show the change in rsi in percentage.
Ex: suppose the rsi of a symbol at present is 60 and the previous value of rsi was 52,
as you can see the rsi has increased, which is a sign of the symbol being bullish .
this indicator will tell by what percentage the rsi of the symbol has increased or decreased.
for the above example, the change in rsi is 15.38% increase.
this is set to default chart time-frame.
オープンソーススクリプト
TradingViewの精神に則り、このスクリプトの作者はコードをオープンソースとして公開してくれました。トレーダーが内容を確認・検証できるようにという配慮です。作者に拍手を送りましょう!無料で利用できますが、コードの再公開はハウスルールに従う必要があります。
免責事項
この情報および投稿は、TradingViewが提供または推奨する金融、投資、トレード、その他のアドバイスや推奨を意図するものではなく、それらを構成するものでもありません。詳細は利用規約をご覧ください。
オープンソーススクリプト
TradingViewの精神に則り、このスクリプトの作者はコードをオープンソースとして公開してくれました。トレーダーが内容を確認・検証できるようにという配慮です。作者に拍手を送りましょう!無料で利用できますが、コードの再公開はハウスルールに従う必要があります。
免責事項
この情報および投稿は、TradingViewが提供または推奨する金融、投資、トレード、その他のアドバイスや推奨を意図するものではなく、それらを構成するものでもありません。詳細は利用規約をご覧ください。