INVITE-ONLY SCRIPT
更新済 RSI Overbought, Oversold and over/under midline
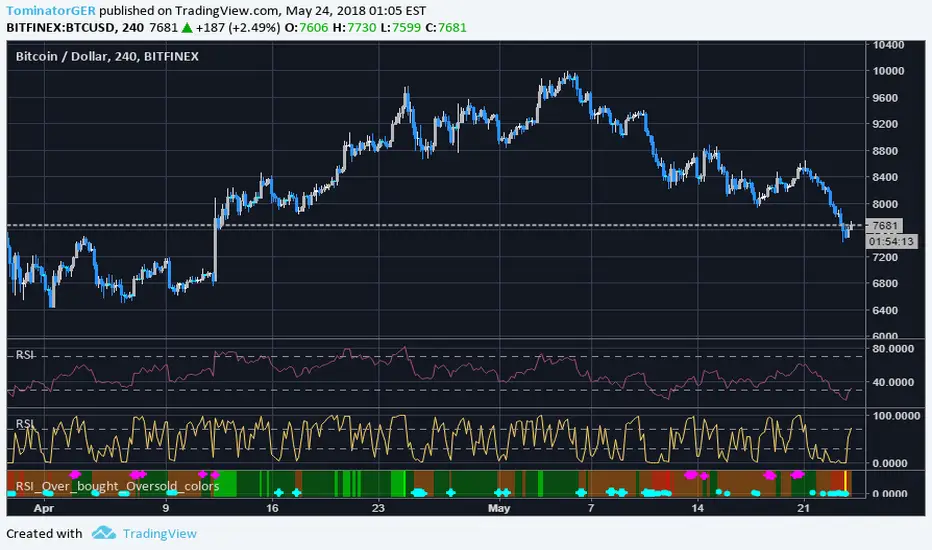
Made that script where you get a very quick overview about the current RSI state. There are different colors and symbols available:
The indicator is designed to work on multiple chart layouts and smaller screens where you would not see the exact RSI states in the normal RSI indicator. You can also identify the RSI state very quick and it saves you space because you can identify the states even if the indicator window is very small.
Please give feedback in the comments what you think and what you would do better.
For access please leave a comment.
- Circles = RSI 2 period is in overbought /-sold -> Weaker buy / sell signal
- Cross = RSI 2 period is in overbought /-sold + price is above MA200 + below MA5 -> stronger buy / sell entry signal
- brown / dark green background = RSI 14 over or under midline -> Indicates bullish / bearisch momentum
- light red / green background = RSI 14 over 70 or under 30 -> Normal RSI overbought /-sold state
- red / bright green background = RSI 14 over 80 or under 20 -> Stronger RSI overbought /-sold state
- yellow background = RSI 14 over / under the 52 week high / low -> Very strong RSI overbought /-sold state
The indicator is designed to work on multiple chart layouts and smaller screens where you would not see the exact RSI states in the normal RSI indicator. You can also identify the RSI state very quick and it saves you space because you can identify the states even if the indicator window is very small.
Please give feedback in the comments what you think and what you would do better.
For access please leave a comment.
リリースノート
Added lower timeframe supportリリースノート
Various fixes招待専用スクリプト
このスクリプトは作者が承認したユーザーのみアクセス可能です。使用するにはアクセス申請をして許可を得る必要があります。通常は支払い後に承認されます。詳細は下記の作者の指示に従うか、TominatorGERに直接お問い合わせください。
TradingViewは、作者を完全に信頼し、スクリプトの動作を理解していない限り、有料スクリプトの購入・使用を推奨しません。コミュニティスクリプトには無料のオープンソースの代替が多数あります。
作者の指示
免責事項
この情報および投稿は、TradingViewが提供または推奨する金融、投資、トレード、その他のアドバイスや推奨を意図するものではなく、それらを構成するものでもありません。詳細は利用規約をご覧ください。
招待専用スクリプト
このスクリプトは作者が承認したユーザーのみアクセス可能です。使用するにはアクセス申請をして許可を得る必要があります。通常は支払い後に承認されます。詳細は下記の作者の指示に従うか、TominatorGERに直接お問い合わせください。
TradingViewは、作者を完全に信頼し、スクリプトの動作を理解していない限り、有料スクリプトの購入・使用を推奨しません。コミュニティスクリプトには無料のオープンソースの代替が多数あります。
作者の指示
免責事項
この情報および投稿は、TradingViewが提供または推奨する金融、投資、トレード、その他のアドバイスや推奨を意図するものではなく、それらを構成するものでもありません。詳細は利用規約をご覧ください。