PROTECTED SOURCE SCRIPT
Inverse Volatility by Dereek69
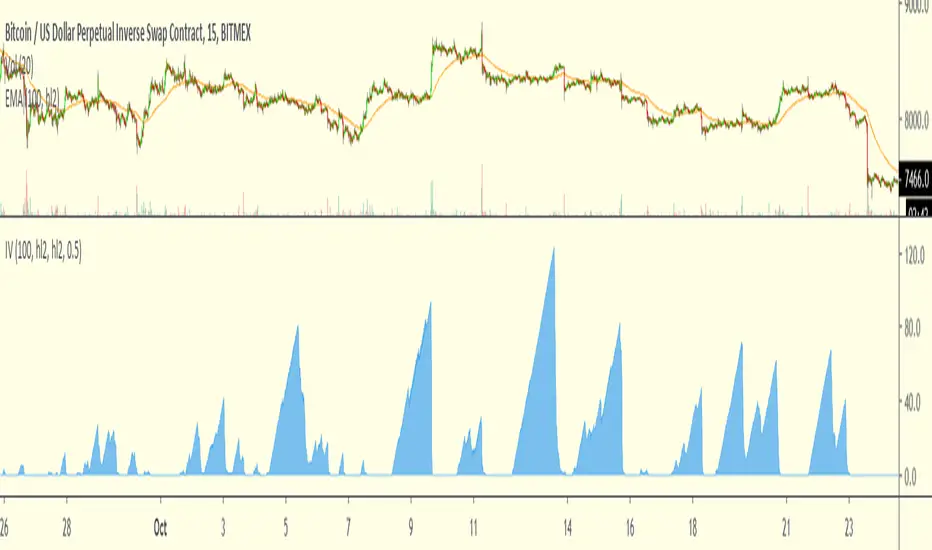
The higher the IV value is the longest the price have been close to the EMA and so the trend has been stable or the price is flat
It works best on low timeframes, developed on BTCUSD 15m chart
The EMA used (100) can be changed and so can the range of price around it where the indicator goes up (1%)
It works best on low timeframes, developed on BTCUSD 15m chart
The EMA used (100) can be changed and so can the range of price around it where the indicator goes up (1%)
保護スクリプト
このスクリプトのソースコードは非公開で投稿されています。 ただし、制限なく自由に使用できます – 詳細はこちらでご確認ください。
免責事項
この情報および投稿は、TradingViewが提供または推奨する金融、投資、トレード、その他のアドバイスや推奨を意図するものではなく、それらを構成するものでもありません。詳細は利用規約をご覧ください。
免責事項
この情報および投稿は、TradingViewが提供または推奨する金融、投資、トレード、その他のアドバイスや推奨を意図するものではなく、それらを構成するものでもありません。詳細は利用規約をご覧ください。