INVITE-ONLY SCRIPT
Trend Ladder Pro
Trend Ladder Pro
Detail Explanation:
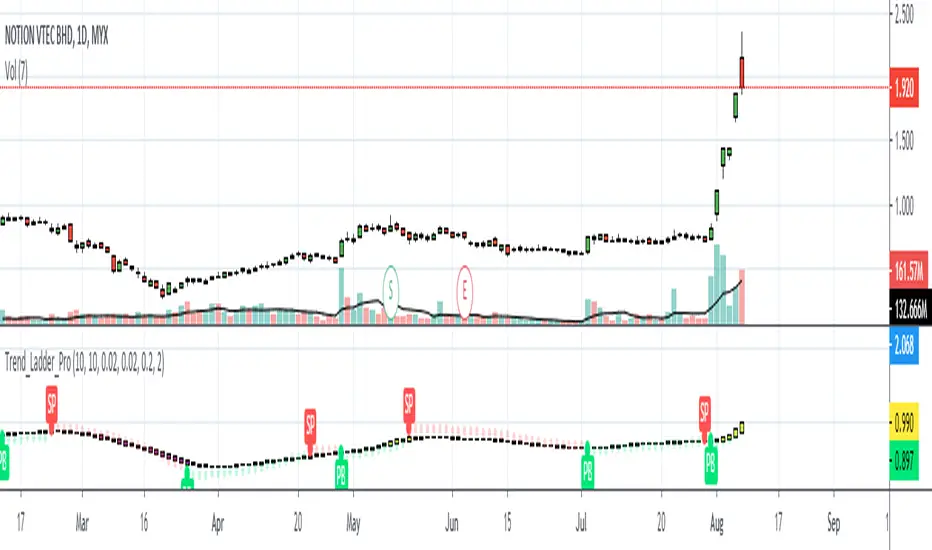
1. Purple Ladder
- Indicate that the market share is in a bearish trend. The ladder is heikin ashi candle which gives the smoother and uninterrupted downtrend.
2. Yellow Ladder
- Indicate that the market share is in a bullish trend. The ladder is heikin ashi candle which gives the smoother and uninterrupted uptrend.
3. Selling Pressure(SP)
- This signal shows that the selling pressure starting to take over the market shares. It appear when the first dot triggered to warn the traders from entering the market share or to take profit if they already holding position.
4. Pullback(PB)
- This signal shows that traders starting to have an interest in the market shares and having a pullback signal. It appear when the first dot triggered to alert the traders so that the market share can be put in the watchlist.
5. Red and Green Dot
- These dots are Parabolic SAR with the default setting but custom colors depending on the user interest. The dots are below as the price moving uptrend and above when the price downtrend. However, during sideways there will be a lot of false signals.
Contact me if you want to try the indicator.
Detail Explanation:
1. Purple Ladder
- Indicate that the market share is in a bearish trend. The ladder is heikin ashi candle which gives the smoother and uninterrupted downtrend.
2. Yellow Ladder
- Indicate that the market share is in a bullish trend. The ladder is heikin ashi candle which gives the smoother and uninterrupted uptrend.
3. Selling Pressure(SP)
- This signal shows that the selling pressure starting to take over the market shares. It appear when the first dot triggered to warn the traders from entering the market share or to take profit if they already holding position.
4. Pullback(PB)
- This signal shows that traders starting to have an interest in the market shares and having a pullback signal. It appear when the first dot triggered to alert the traders so that the market share can be put in the watchlist.
5. Red and Green Dot
- These dots are Parabolic SAR with the default setting but custom colors depending on the user interest. The dots are below as the price moving uptrend and above when the price downtrend. However, during sideways there will be a lot of false signals.
Contact me if you want to try the indicator.
招待専用スクリプト
このスクリプトは作者が承認したユーザーのみアクセス可能です。使用するにはアクセス申請をして許可を得る必要があります。通常は支払い後に承認されます。詳細は下記の作者の指示に従うか、Trader_Cenonetに直接お問い合わせください。
TradingViewは、作者を完全に信頼し、スクリプトの動作を理解していない限り、有料スクリプトの購入・使用を推奨しません。コミュニティスクリプトには無料のオープンソースの代替が多数あります。
作者の指示
免責事項
この情報および投稿は、TradingViewが提供または推奨する金融、投資、トレード、その他のアドバイスや推奨を意図するものではなく、それらを構成するものでもありません。詳細は利用規約をご覧ください。