PROTECTED SOURCE SCRIPT
更新済 LA_Periodic_Fibonacci Levels
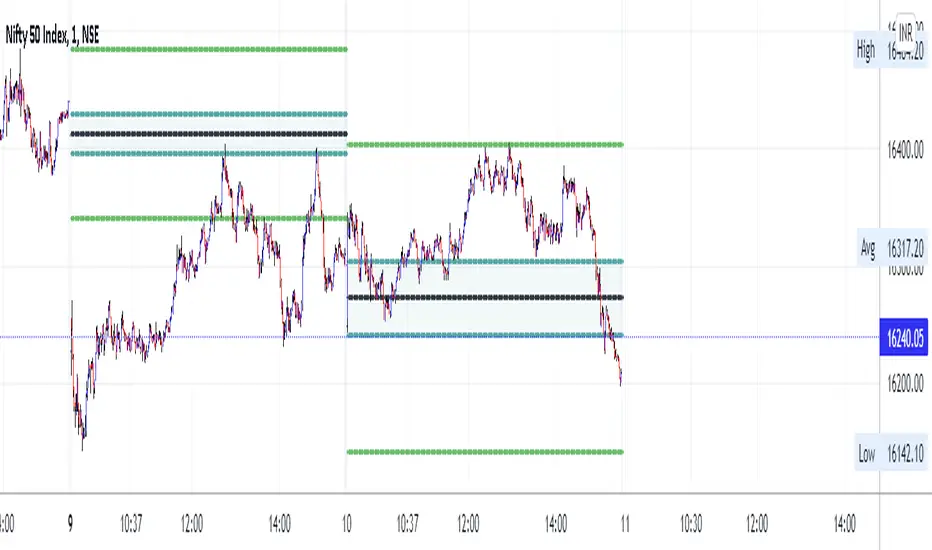
This indicator is used to plot the previous high and low of the chosen timeframe along with the Fibonacci levels of 0.50, +/- 0.618 and +/- 0.786.
Provision is given to plot levels for three different time frames at a time.
Options are given to select/unselect the levels as per the user requirement. For plotting the Fibonacci levels of a specific period, user has to select the option "TF1_Fib" or "TF2_Fib" or "TF3_Fib" along with the respective levels (50, +/- 0.618, +/- 0.786).
User has to add different time frames in their layout which can then be used in the drop down menu. By default, daily, weekly and monthly time frames are given.
Indicator is plotted as the candle progresses and not plotted for future time frames in advance.
Below are few examples on larger timeframes.
BTCUSD on 1 min TF (timeframe)

BTCUSD on Daily TF

DJI on Daily TF

Provision is given to plot levels for three different time frames at a time.
Options are given to select/unselect the levels as per the user requirement. For plotting the Fibonacci levels of a specific period, user has to select the option "TF1_Fib" or "TF2_Fib" or "TF3_Fib" along with the respective levels (50, +/- 0.618, +/- 0.786).
User has to add different time frames in their layout which can then be used in the drop down menu. By default, daily, weekly and monthly time frames are given.
Indicator is plotted as the candle progresses and not plotted for future time frames in advance.
Below are few examples on larger timeframes.
BTCUSD on 1 min TF (timeframe)
BTCUSD on Daily TF
DJI on Daily TF
リリースノート
We have included the 1.272 and 1.618 levels for projections. User can select the levels accordinglyNifty50 on a Daily chart with indicator for 12 months
Nifty50 on 1min chart with indicator for 1 hour
保護スクリプト
このスクリプトのソースコードは非公開で投稿されています。 ただし、制限なく自由に使用できます – 詳細はこちらでご確認ください。
@aravindleo_45
免責事項
この情報および投稿は、TradingViewが提供または推奨する金融、投資、トレード、その他のアドバイスや推奨を意図するものではなく、それらを構成するものでもありません。詳細は利用規約をご覧ください。
保護スクリプト
このスクリプトのソースコードは非公開で投稿されています。 ただし、制限なく自由に使用できます – 詳細はこちらでご確認ください。
@aravindleo_45
免責事項
この情報および投稿は、TradingViewが提供または推奨する金融、投資、トレード、その他のアドバイスや推奨を意図するものではなく、それらを構成するものでもありません。詳細は利用規約をご覧ください。