PROTECTED SOURCE SCRIPT
更新済 Market Breadth Ratios
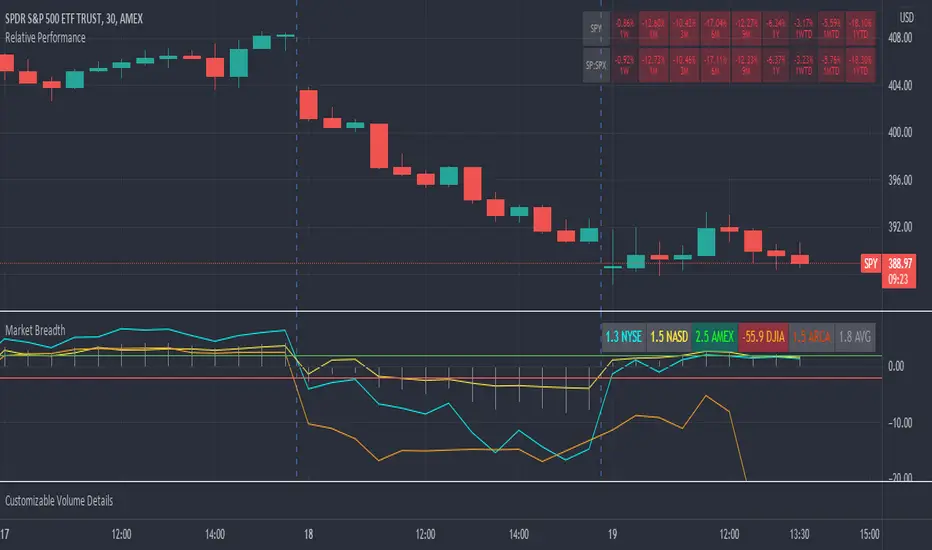
This indicator provides breadth ratios for various indices/exchanges based on the up/down volume.
Breadth ratios included for NYSE, NASDAQ, AMEX, DJIA, ARCA, and and average.
Very straight forward to use, if the ratios is above 2, stocks should be in uptrend, below -2 stocks should trend down. In between 2 and -2 is going to be a choppy market.
Breadth ratios included for NYSE, NASDAQ, AMEX, DJIA, ARCA, and and average.
Very straight forward to use, if the ratios is above 2, stocks should be in uptrend, below -2 stocks should trend down. In between 2 and -2 is going to be a choppy market.
リリースノート
-Minor format changesリリースノート
--Fixed format labelリリースノート
Added conditional coloring to breadth histogramリリースノート
Adjusted the default line and histogram widthリリースノート
-Added user input for the threshold that will flip the breadth histogram from grey to red/green when the momentum/trend ratio passes the threshold.保護スクリプト
このスクリプトのソースコードは非公開で投稿されています。 ただし、制限なく自由に使用できます – 詳細はこちらでご確認ください。
免責事項
この情報および投稿は、TradingViewが提供または推奨する金融、投資、トレード、その他のアドバイスや推奨を意図するものではなく、それらを構成するものでもありません。詳細は利用規約をご覧ください。
免責事項
この情報および投稿は、TradingViewが提供または推奨する金融、投資、トレード、その他のアドバイスや推奨を意図するものではなく、それらを構成するものでもありません。詳細は利用規約をご覧ください。