INVITE-ONLY SCRIPT
更新済 GoldenCO Aie3
Use of GCOv3 strategy for market analysis
This gco3 strategy uses exponential moving average analysis which is 5emas to show the movement of stock prices in the market. It is also to track the impending changes to the market price. the use of EMA is more sensitive to trend changes and it is one way to see the trend of price movements and as a guide to the trader.
The parameters used are EMA5/EMA20/EMA50/EMA100/EMA200.
The above parameters indicate a price condition that includes 4 phases of the price trend, namely the accumulation, uptrend, distribution, and ddowntrend phases.
we hope that, by recognizing and knowing the trend of this price movement it can help traders in trading activities well and can reduce risk. May it benefit the trader.
DISCLAIMER ; This is not Buy/Sell call, Just analysis idea for education. Trade At Your Own Risk
リリースノート
AN UPGRADING OF THE INSTRUMENT AND ALERT CONDITION.INSTRUMENT>
1) Bar colored- to define a trend whether bullish(green) or bearish(red).
2) Background- blue color=price above ema20, red color=price below ema20.
3) The B lime signal has been updated with parameters that are ema5 cross over ema50. it is to get a strong signal for the trend.
ALERT CONDITION>
Now traders can create alerts for conditions in the setting. You can select the types of conditions and where notifications will be sent.
リリースノート
Major updates,1. update to version 5 script
2. New perimeter for exponential moving average.
3. added value to bull & bear trend strategies based on pivot points.
This reorganization is to increase the effectiveness of the EMA strategy and its accessibility to all types of markets and time frames. Parameters and strategies can be used for all markets including the stock market except the exchange.
The chart below is how the strategy uses signals and plots,
FCPO, 3 minutes
How to avoids a false signals
1. Refers biggest/mother trends such as 1 hour or 30 minutes, then entries at smallest should
be follows the biggest/mother
2. identify the supply and demand zones to see the suitability of the position, open buy/sell
zones or taking/exit zones.
*refer to the chart above, we can see that’s why the hitting TP’s ( should be ) was happen
between 11 ticks to 48 ticks, based on supply & demand and trends condition.
see, the signal difference at 5 minutes and 3 minutes,
5m = more clear trend
3m = there are 3 false signals, 6 hits TP
the solution;
if the small trend moves horizontally, or is not clear, or the price movement is close to the Bold EMA (grey plot) so we refer to the larger time frame as a guide.
We can avoid 3 false in 3m earlier if we refer to 5m or above.
BTCUSD 5m
BTCUSD 3m
ETHUSD 3m
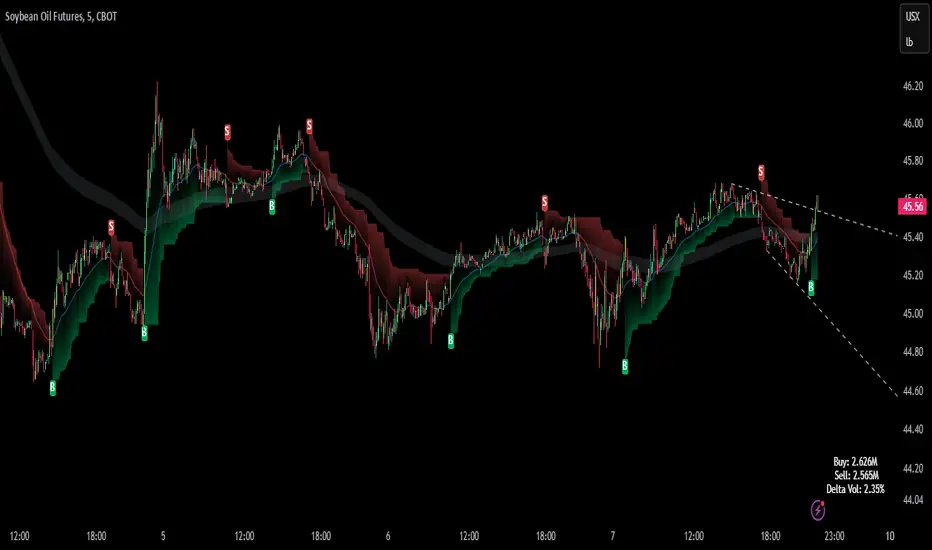
SOY OIL 10m
CRUDE OIL 15m
BURSA STOCKS 5m scalping/intraday
BURSA STOCKS daily TF swing
Customize a style and create an alert/notification
リリースノート
added ema200 close source as a major trendリリースノート
Minor updatesavg_volume_delta = (up_trend_volume + down_trend_volume) / 2
delta Volume percentage = up_trend_volume - down_trend_volume) /
avg_volume_delta.
Use of average volume delta = to see the difference/strength of buyers and
sellers throughout the trend, which is based on the percentage of average
net volume.
major bull/bear trend strategies
How to do if the trends/signals in the small timeframe are not clear/sideways movement
リリースノート
added lower and upper trendline, breakout observationリリースノート
rearrange input settings,minimize lighting, so it's neater/less distracting,
change signal shape,
replace volume label to bottom,
リリースノート
Reduce the distance of the buy/sell volume label plot to the last bar so that it can be viewed in multiple screen displays.招待専用スクリプト
このスクリプトは作者が承認したユーザーのみアクセス可能です。使用するにはアクセス申請をして許可を得る必要があります。通常は支払い後に承認されます。詳細は下記の作者の指示に従うか、TraderAsistに直接お問い合わせください。
TradingViewは、作者を完全に信頼し、スクリプトの動作を理解していない限り、有料スクリプトの購入・使用を推奨しません。コミュニティスクリプトには無料のオープンソースの代替が多数あります。
作者の指示
Invite Only Script - Please message admin for subscribes
免責事項
この情報および投稿は、TradingViewが提供または推奨する金融、投資、トレード、その他のアドバイスや推奨を意図するものではなく、それらを構成するものでもありません。詳細は利用規約をご覧ください。
招待専用スクリプト
このスクリプトは作者が承認したユーザーのみアクセス可能です。使用するにはアクセス申請をして許可を得る必要があります。通常は支払い後に承認されます。詳細は下記の作者の指示に従うか、TraderAsistに直接お問い合わせください。
TradingViewは、作者を完全に信頼し、スクリプトの動作を理解していない限り、有料スクリプトの購入・使用を推奨しません。コミュニティスクリプトには無料のオープンソースの代替が多数あります。
作者の指示
Invite Only Script - Please message admin for subscribes
免責事項
この情報および投稿は、TradingViewが提供または推奨する金融、投資、トレード、その他のアドバイスや推奨を意図するものではなく、それらを構成するものでもありません。詳細は利用規約をご覧ください。