PROTECTED SOURCE SCRIPT
WaveViewer
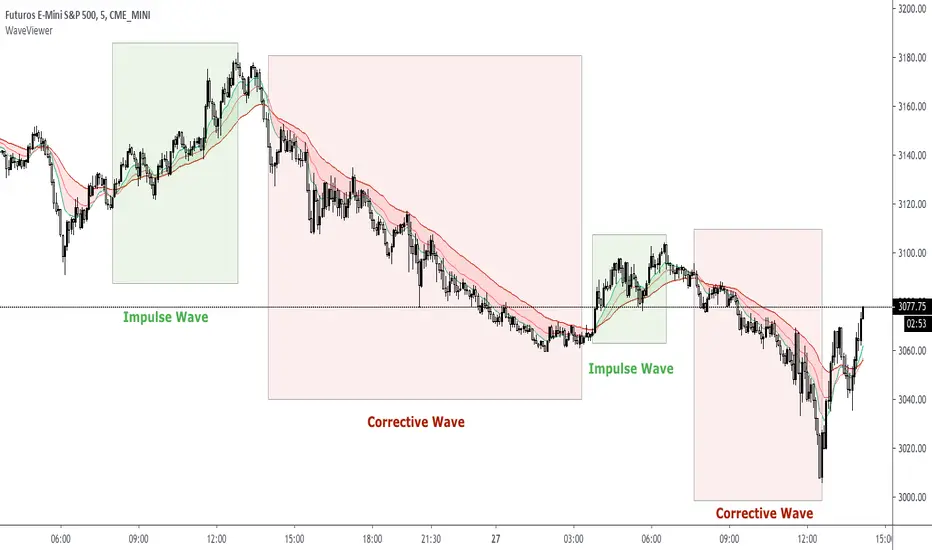
WaveViewer impulsive and corrective wave viewer indicator
The market is developed by making impulsive wave movements and corrective waves thus forming a "V" type fractal
This indicator allows you to easily visualize these movements to make buying or selling decisions
WaveViewer is an indicator that allows the identification of impulsive waves visually through EMAs crossings
Visually facilitates the green color for the impulsive wave and red for the corrective wave
NOTE 1: This indicator should be complemented with the 1-9 fractal counter
NOTE 2: WaveViewer recommended for instrument ES1 ( SP500 ) with timeframe 5 minutes
保護スクリプト
このスクリプトのソースコードは非公開で投稿されています。 ただし、制限なく自由に使用できます – 詳細はこちらでご確認ください。
免責事項
この情報および投稿は、TradingViewが提供または推奨する金融、投資、トレード、その他のアドバイスや推奨を意図するものではなく、それらを構成するものでもありません。詳細は利用規約をご覧ください。
保護スクリプト
このスクリプトのソースコードは非公開で投稿されています。 ただし、制限なく自由に使用できます – 詳細はこちらでご確認ください。
免責事項
この情報および投稿は、TradingViewが提供または推奨する金融、投資、トレード、その他のアドバイスや推奨を意図するものではなく、それらを構成するものでもありません。詳細は利用規約をご覧ください。