INVITE-ONLY SCRIPT
The Real Dynamic Lookback Asaf Biton
The Real Dynamic Lookback – Asaf Biton
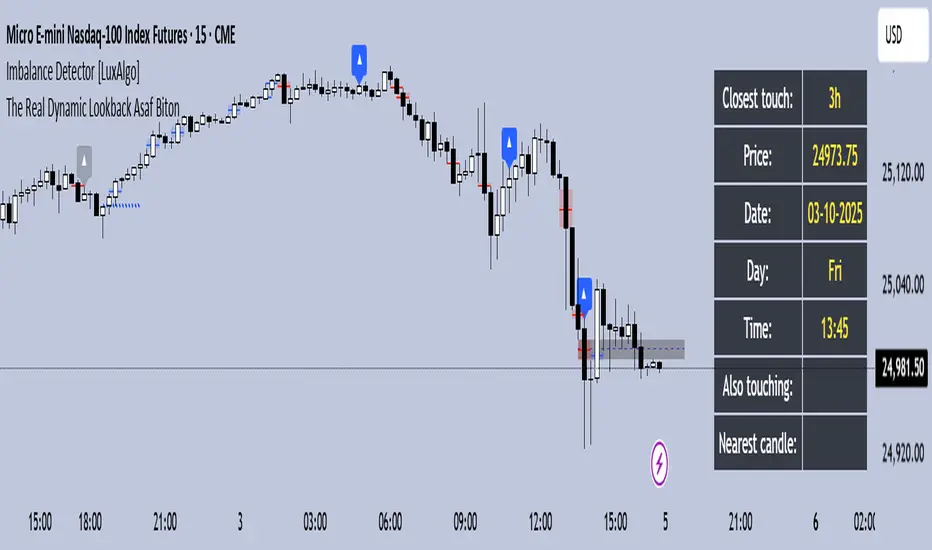
This indicator dynamically tracks historical candles at predefined lookback intervals (in hours) and visually highlights them on the chart.
Dynamic Lookback Arrows: Marks candles from the chosen lookback groups (3h, 6h, 12h, … up to 336h) with arrows. Colors indicate whether the candle falls on the same New York trading day or not.
HUD Panel: Displays real-time information about the closest candle that overlaps with the current price range, including its price, date, day, and time.
Also Touching: If multiple candles overlap with the current bar, the closest one in time is prioritized, and the rest are listed as "Also touching".
Nearest Candle: If no overlap occurs, the HUD shows the nearest candle in terms of price proximity.
Timeframe Restriction: Works only on 15m, 30m, and 1h charts to maintain accuracy.
Customization: Users can enable or disable different lookback groups and toggle HUD/arrows.
This tool is useful for identifying recurring price reactions, time-based cycles, and historical reference points in a structured, visual way.
📌 תיאור בעברית
The Real Dynamic Lookback – אסף ביטון
האינדיקטור מזהה ומציג נרות היסטוריים לפי מחזורי זמן מוגדרים מראש (בשעות), ומסמן אותם באופן ויזואלי על הגרף.
חצים דינמיים: סימון נרות במחזורי זמן נבחרים (3h, 6h, 12h ועד 336h). הצבע משתנה בהתאם אם הנר נמצא באותו יום מסחר בניו יורק או לא.
תצוגת HUD: מציגה בזמן אמת את הנר הקרוב ביותר שנוגע בטווח המחירים של הנר הנוכחי, כולל המחיר, התאריך, היום והשעה.
Also Touching: כאשר יותר מנר אחד נוגע בטווח הנר הנוכחי, האינדיקטור נותן עדיפות לנר הקרוב ביותר בזמן ואת השאר מציג ברשימה.
Nearest Candle: אם אין נרות שנוגעים במחיר הנוכחי, מוצג הנר הקרוב ביותר מבחינת מרחק מחיר.
מגבלת טיים פריים: עובד אך ורק על גרפים של 15 דקות, 30 דקות או שעה, לשמירה על דיוק.
התאמה אישית: ניתן לבחור אילו קבוצות מחזורי זמן להפעיל ולהחליט האם להציג חצים ו-HUD.
האינדיקטור מיועד לניתוח חזרות מחירים, מחזורי זמן והשוואה לנקודות היסטוריות בצורה ברורה ונוחה.
招待専用スクリプト
このスクリプトは作者が承認したユーザーのみアクセス可能です。使用するにはアクセス申請をして許可を得る必要があります。通常は支払い後に承認されます。詳細は下記の作者の指示に従うか、asafbiton1に直接お問い合わせください。
TradingViewは、作者を完全に信頼し、スクリプトの動作を理解していない限り、有料スクリプトの購入・使用を推奨しません。コミュニティスクリプトには無料のオープンソースの代替が多数あります。
作者の指示
The Real Dynamic Lookback – Asaf Biton
This indicator dynamically tracks historical candles at predefined lookback intervals (in hours) and visually highlights them on the chart.
Dynamic Lookback Arrows: Marks candles from the chosen lookback groups (3h,
免責事項
この情報および投稿は、TradingViewが提供または推奨する金融、投資、トレード、その他のアドバイスや推奨を意図するものではなく、それらを構成するものでもありません。詳細は利用規約をご覧ください。