PROTECTED SOURCE SCRIPT
[DEM] Ichimoku Bars
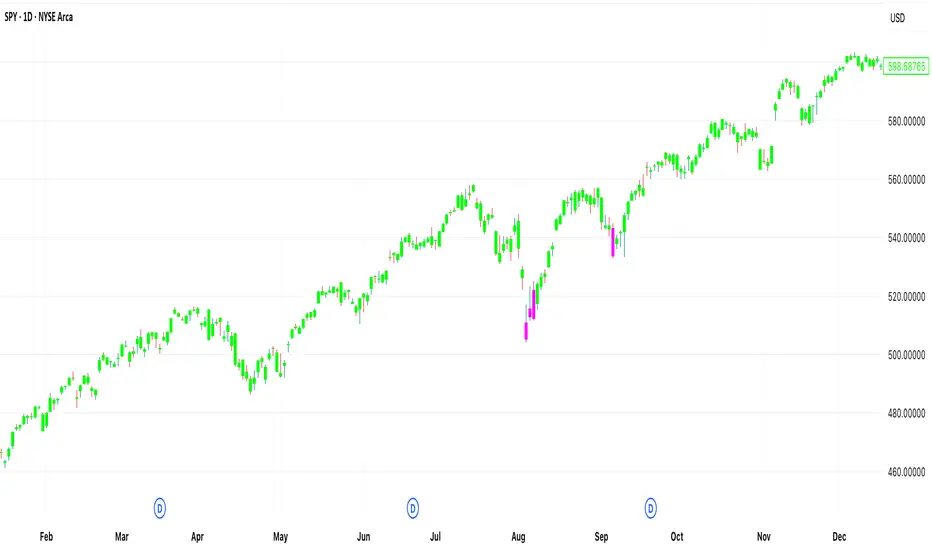
[DEM] Ichimoku Bars is designed to color price bars based on their relationship to the Ichimoku Cloud (Kumo) by comparing the current close price to both Leading Span A and Leading Span B from the traditional Ichimoku system, but with added smoothing modifications. The indicator calculates the standard Ichimoku components using Donchian midlines for the Conversion and Base lines, then creates smoothed versions of Leading Span A (20-period RMA of the average between Conversion and Base lines) and Leading Span B (20-period RMA of the 52-period Donchian midline), both displaced forward by the lagging span period. Bars are colored green when price is above both leading spans (indicating strong bullish conditions above the cloud), red when price is below both leading spans (indicating strong bearish conditions below the cloud), and magenta when price is within the cloud (indicating neutral or transitional conditions), providing traders with immediate visual feedback about price position relative to the Ichimoku equilibrium zone.
保護スクリプト
このスクリプトのソースコードは非公開で投稿されています。 ただし、制限なく自由に使用できます – 詳細はこちらでご確認ください。
免責事項
この情報および投稿は、TradingViewが提供または推奨する金融、投資、トレード、その他のアドバイスや推奨を意図するものではなく、それらを構成するものでもありません。詳細は利用規約をご覧ください。
保護スクリプト
このスクリプトのソースコードは非公開で投稿されています。 ただし、制限なく自由に使用できます – 詳細はこちらでご確認ください。
免責事項
この情報および投稿は、TradingViewが提供または推奨する金融、投資、トレード、その他のアドバイスや推奨を意図するものではなく、それらを構成するものでもありません。詳細は利用規約をご覧ください。