INVITE-ONLY SCRIPT
Relative Strength Index by YSTC
This is a PAID Indicator from Volume Profile and VWAP Pack.
According to payment you will either get a TradingView account with indicators activated or
Have to send an email to contact@ystc.in with the email you used to sign up with us, and with your TradingView Username.
The script is available (for free) to YSTC's Course members of "Trading with PAV".
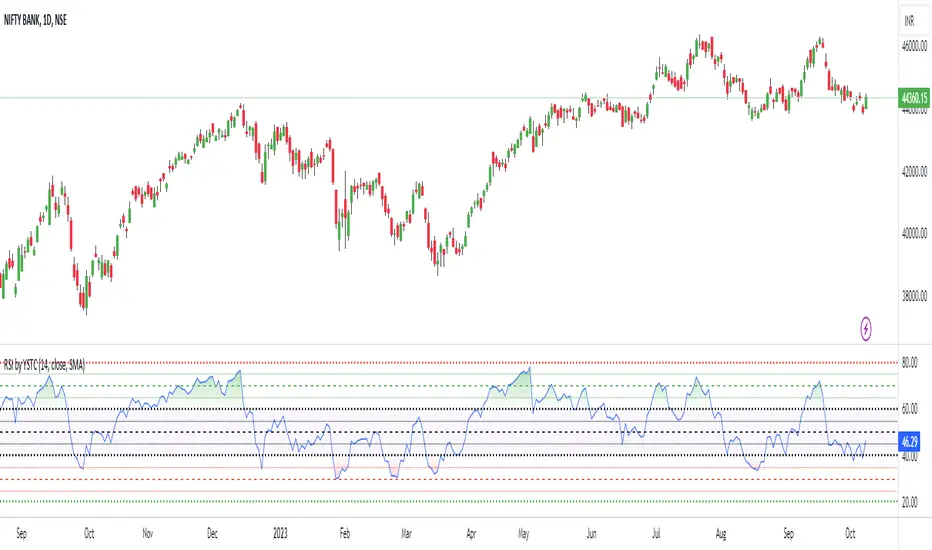
Relative Strength Index (RSI)
A momentum based oscillator which is used to measure the speed (velocity) as well as the change (magnitude) of directional price movements.
What Different about this RSI by YSTC.
You get Support and Resistance lines for RSI which are 20, 30, 40, 50, 60, 70, 80. as shown below.

It can also show RSI Candles as shown below.

For those who want all types of MA with MA Cross can play with this indicator. Below is MA Cross of 9, 21.

And for NEW user with untrained eyes who cant yet detect Divergence this indicator Saves you the trouble of finding.
Below is Regular Bullish and Bearish Divergence. Linewidth 2.

Below is Hidden Bullish and Bearish Divergence. Linewidth 1.

You can add this script to your chart by clicking "Add to favorite indicators" below.
Have Questions ?
contact@ystc.in
Free Stock Market Introduction Available.
Name: Yogesh Patil (YS Trading Coach).
Contact: +91 9637070868.
Time: Monday to Friday (10:00 AM - 07:00 PM).
According to payment you will either get a TradingView account with indicators activated or
Have to send an email to contact@ystc.in with the email you used to sign up with us, and with your TradingView Username.
The script is available (for free) to YSTC's Course members of "Trading with PAV".
Relative Strength Index (RSI)
A momentum based oscillator which is used to measure the speed (velocity) as well as the change (magnitude) of directional price movements.
What Different about this RSI by YSTC.
You get Support and Resistance lines for RSI which are 20, 30, 40, 50, 60, 70, 80. as shown below.
It can also show RSI Candles as shown below.
For those who want all types of MA with MA Cross can play with this indicator. Below is MA Cross of 9, 21.
And for NEW user with untrained eyes who cant yet detect Divergence this indicator Saves you the trouble of finding.
Below is Regular Bullish and Bearish Divergence. Linewidth 2.
Below is Hidden Bullish and Bearish Divergence. Linewidth 1.
You can add this script to your chart by clicking "Add to favorite indicators" below.
Have Questions ?
contact@ystc.in
Free Stock Market Introduction Available.
Name: Yogesh Patil (YS Trading Coach).
Contact: +91 9637070868.
Time: Monday to Friday (10:00 AM - 07:00 PM).
招待専用スクリプト
このスクリプトは作者が承認したユーザーのみアクセス可能です。使用するにはアクセス申請をして許可を得る必要があります。通常は支払い後に承認されます。詳細は下記の作者の指示に従うか、YSTradingCoachに直接お問い合わせください。
このプライベートの招待専用スクリプトはモデレーターによる審査を受けておらず、ハウスルールへの準拠状況は未確認です。 TradingViewは、作者を完全に信頼し、スクリプトの動作を理解していない限り、有料スクリプトの購入・使用を推奨しません。コミュニティスクリプトには無料のオープンソースの代替が多数あります。
作者の指示
A PAID Indicator from Volume Profile and VWAP Pack.
According to payment you will either get a TradingView account with indicators activated or
Have to send an email to contact@ystc.in with the email you used to sign up with us, and your TV username.
免責事項
この情報および投稿は、TradingViewが提供または推奨する金融、投資、トレード、その他のアドバイスや推奨を意図するものではなく、それらを構成するものでもありません。詳細は利用規約をご覧ください。