INVITE-ONLY SCRIPT
更新済 Sonarlab - Volume Profile
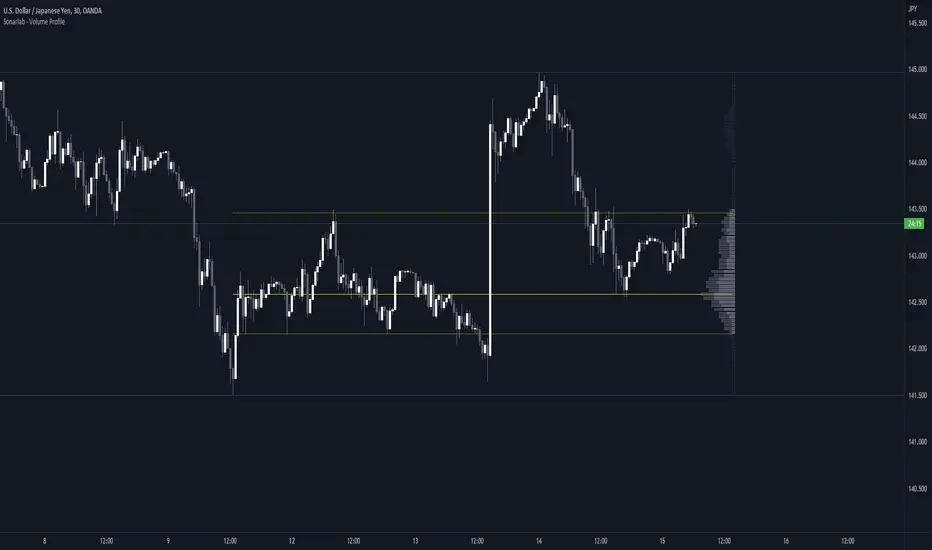
This Volume Profile is a charting tool that traders use to show the traded volume amount over a given time period. The reason we build this volume profile indicator is to confirm S&D zones and show where the most volume is resting in a specific given time.
Settings
- Auto Placement: Option to have the Volume Profile automatically placed
- Manual Placement: Able to place and move the Volume Profile anywhere of your choosing
- Bull vs. Bear Candle Style
- Up/Down Candle Style
- Highlight Point of Control (PoC)

Usage:
Focused on combining with SMC:
When trading SMC, normal volume profiles can be confusing and hard to trade - since it will catch the volume on the overall chart you're on. When trading SMC, we are interested in catching specific parts in a range which defines supply or demand.
What makes this volume profile different?
The Sonarlab Volume Profile is focused on combining with SMC, integrated with Smart Money Concepts (SMC) levels, such as the Swing High and Low levels. The Indicator will automatically find the most applicable position using our custom Swing Levels to provide users with maximum utility with zero effort. Where other volume profiles are more focused on overall volume, this volume profile is focused on volume in a specific range on automation using swing points in the market.

As in this example, the high volume areas are matching with traditional supply and demand zones. The price level with the most volume is highlighted by the "point of control" (POC), displayed by the yellow line. We can consider price will react from those "high volume" areas and trade more easily through "low volume" areas.
Settings
- Auto Placement: Option to have the Volume Profile automatically placed
- Manual Placement: Able to place and move the Volume Profile anywhere of your choosing
- Bull vs. Bear Candle Style
- Up/Down Candle Style
- Highlight Point of Control (PoC)
Usage:
Focused on combining with SMC:
When trading SMC, normal volume profiles can be confusing and hard to trade - since it will catch the volume on the overall chart you're on. When trading SMC, we are interested in catching specific parts in a range which defines supply or demand.
What makes this volume profile different?
The Sonarlab Volume Profile is focused on combining with SMC, integrated with Smart Money Concepts (SMC) levels, such as the Swing High and Low levels. The Indicator will automatically find the most applicable position using our custom Swing Levels to provide users with maximum utility with zero effort. Where other volume profiles are more focused on overall volume, this volume profile is focused on volume in a specific range on automation using swing points in the market.
As in this example, the high volume areas are matching with traditional supply and demand zones. The price level with the most volume is highlighted by the "point of control" (POC), displayed by the yellow line. We can consider price will react from those "high volume" areas and trade more easily through "low volume" areas.
リリースノート
- Added option to display the Volume Profile on the right side of price- Added Value Area Lines
- Minor bug fixes and changes
リリースノート
- Minor Bug Fixes招待専用スクリプト
このスクリプトは作者が承認したユーザーのみアクセス可能です。使用するにはアクセス申請をして許可を得る必要があります。通常は支払い後に承認されます。詳細は下記の作者の指示に従うか、vuetratradingに直接お問い合わせください。
TradingViewは、作者を完全に信頼し、スクリプトの動作を理解していない限り、有料スクリプトの購入・使用を推奨しません。コミュニティスクリプトには無料のオープンソースの代替が多数あります。
作者の指示
Send us a PM or hit us up on Discord
免責事項
この情報および投稿は、TradingViewが提供または推奨する金融、投資、トレード、その他のアドバイスや推奨を意図するものではなく、それらを構成するものでもありません。詳細は利用規約をご覧ください。
招待専用スクリプト
このスクリプトは作者が承認したユーザーのみアクセス可能です。使用するにはアクセス申請をして許可を得る必要があります。通常は支払い後に承認されます。詳細は下記の作者の指示に従うか、vuetratradingに直接お問い合わせください。
TradingViewは、作者を完全に信頼し、スクリプトの動作を理解していない限り、有料スクリプトの購入・使用を推奨しません。コミュニティスクリプトには無料のオープンソースの代替が多数あります。
作者の指示
Send us a PM or hit us up on Discord
免責事項
この情報および投稿は、TradingViewが提供または推奨する金融、投資、トレード、その他のアドバイスや推奨を意図するものではなく、それらを構成するものでもありません。詳細は利用規約をご覧ください。