PROTECTED SOURCE SCRIPT
Darvas Box – VsMarketTrend-V1.0
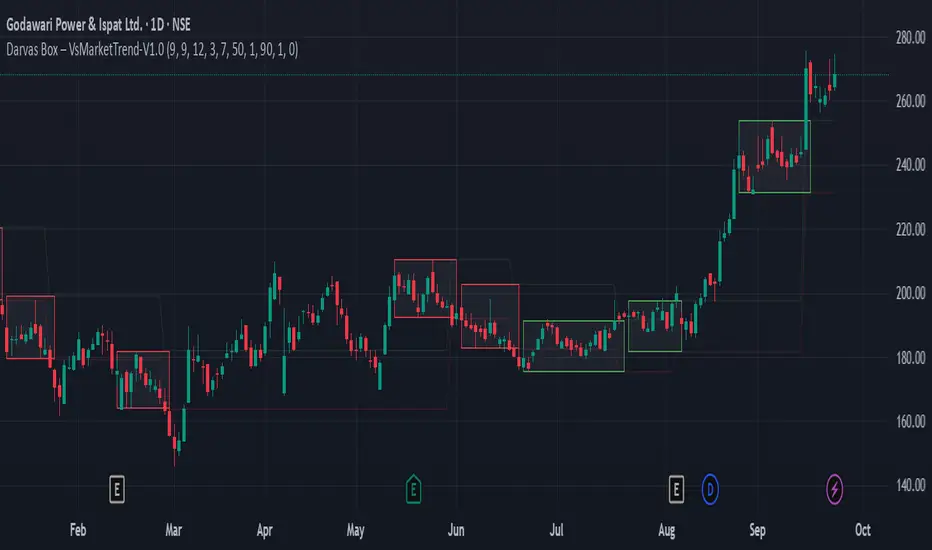
Darvas Box is an advanced consolidation & breakout detection tool inspired by Nicolas Darvas’ famous trading principles.
This script helps you automatically detect consolidation zones (Darvas Boxes) on the chart and highlights breakout points with clear visual boxes. It is designed for swing traders and breakout traders who want to identify price compression zones where strong moves are likely to happen.
🔍 How It Works
The indicator looks back a consolidation window (number of bars).
If price stays within a tight range (max % width) and meets the closing conditions, a Darvas Box is drawn.
Boxes extend to the right until price breaks above or below the range.
Breakouts are color-coded:
✅ Green border → breakout UP
❌ Red border → breakout DOWN
Neutral boxes remain gray until breakout.
Alerts can be enabled to notify on breakouts.
⚙️ Inputs Explained
Consolidation window (bars): Number of bars to check for consolidation.
Minimum bars required: Ensures the box has at least this many bars inside.
Max consolidation width (%): Rejects wide ranges (only considers tight consolidations).
Confirm bars: Waits this many bars before finalizing a box (cancels if price makes a higher high).
Min closes inside inner range: How many candle closes must lie inside the inner band (center zone of the range).
Inner band width (%): The % of the consolidation range considered as the “inner zone.” Lower = stricter.
Strict bar check?: If enabled, all opens & closes must lie inside the consolidation range.
Extend box right (bars): Extends the box into future candles for better visualization.
Box fill transparency: Control visibility of box shading.
Border width: Thickness of box borders.
Neutral / Breakout colors: Colors for neutral, up-breakout, and down-breakout borders.
Show Top/Bottom labels: Display price levels at the box top and bottom.
Alert on breakout: Trigger alerts when price breaks out of a box.
Min % separation: Prevents back-to-back boxes if the new range is too close to the last one.
🎯 Use Cases
Swing Trading: Identify tight ranges before major breakouts.
Breakout Trading: Wait for confirmation of break above/below the box.
Backtesting: Analyze how past consolidations led to strong moves.
⚠️ Notes & Best Practices
Works best on higher timeframes (1H, 4H, Daily) to filter noise.
Use along with volume, RSI, or institutional flow tools for confluence.
This indicator is not a buy/sell signal. It highlights potential breakouts — traders should confirm with their strategy.
For cleaner boxes:
Use consolidation window 8–15 bars.
Keep max consolidation width 8–12%.
Use inner band % ~50%.
Min closes inside = 3–7.
📢 Alerts
Enable “Alert on breakout” to get notified instantly when a Darvas Box breaks up or down.
保護スクリプト
このスクリプトのソースコードは非公開で投稿されています。 無料かつ制限なしでご利用いただけます ― 詳細についてはこちらをご覧ください。
免責事項
これらの情報および投稿は、TradingViewが提供または保証する金融、投資、取引、またはその他の種類のアドバイスや推奨を意図したものではなく、またそのようなものでもありません。詳しくは利用規約をご覧ください。
保護スクリプト
このスクリプトのソースコードは非公開で投稿されています。 無料かつ制限なしでご利用いただけます ― 詳細についてはこちらをご覧ください。
免責事項
これらの情報および投稿は、TradingViewが提供または保証する金融、投資、取引、またはその他の種類のアドバイスや推奨を意図したものではなく、またそのようなものでもありません。詳しくは利用規約をご覧ください。