INVITE-ONLY SCRIPT
KD_RSI345
Creator: Andrew Palladino/Rob Booker
Modified: 2/12/2017
Description:
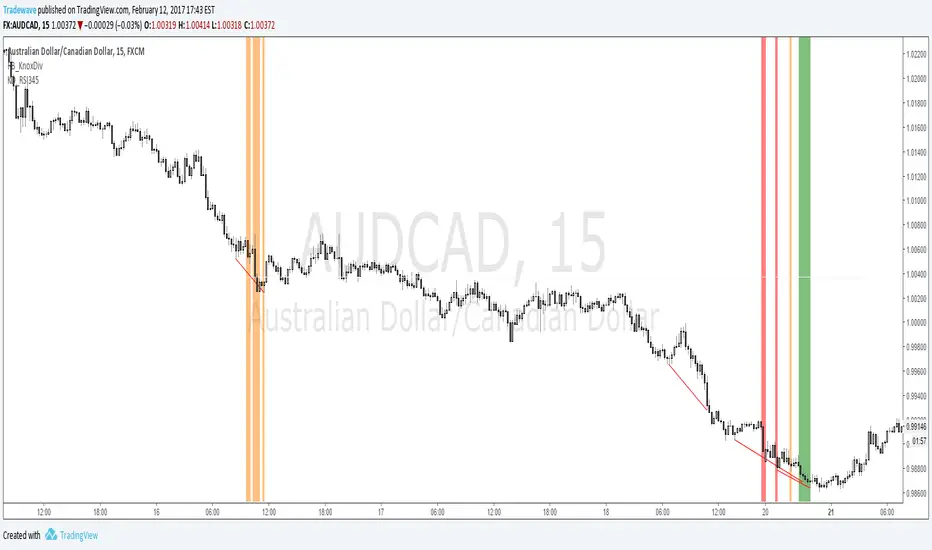
The indicator searches for instances where there is a Knoxville divergence combined with multiple time frame RSI Oversold/Overbought conditions.
When a bullish Knoxville Divergence (KD) is present and price is oversold across 3 time frames, within the KD bar range, a vertical green line is displayed on the chart.
When a bullish Knoxville Divergence (KD) is present and price is oversold across 4 time frames, within the KD bar range, a vertical orange line is displayed on the chart.
When a bullish Knoxville Divergence (KD) is present and price is oversold across 3 time frames, within the KD bar range, a vertical red line is displayed on the chart.
Same applies for Bearish Knoxville Divergence in overbought conditions.
Modified: 2/12/2017
Description:
The indicator searches for instances where there is a Knoxville divergence combined with multiple time frame RSI Oversold/Overbought conditions.
When a bullish Knoxville Divergence (KD) is present and price is oversold across 3 time frames, within the KD bar range, a vertical green line is displayed on the chart.
When a bullish Knoxville Divergence (KD) is present and price is oversold across 4 time frames, within the KD bar range, a vertical orange line is displayed on the chart.
When a bullish Knoxville Divergence (KD) is present and price is oversold across 3 time frames, within the KD bar range, a vertical red line is displayed on the chart.
Same applies for Bearish Knoxville Divergence in overbought conditions.
招待専用スクリプト
こちらのスクリプトにアクセスできるのは投稿者が承認したユーザーだけです。投稿者にリクエストして使用許可を得る必要があります。通常の場合、支払い後に許可されます。詳細については、以下、作者の指示をお読みになるか、LiquidityTrackerに直接ご連絡ください。
スクリプトの機能を理解し、その作者を全面的に信頼しているのでなければ、お金を支払ってまでそのスクリプトを利用することをTradingViewとしては「非推奨」としています。コミュニティスクリプトの中で、その代わりとなる無料かつオープンソースのスクリプトを見つけられる可能性もあります。
作者の指示
免責事項
これらの情報および投稿は、TradingViewが提供または保証する金融、投資、取引、またはその他の種類のアドバイスや推奨を意図したものではなく、またそのようなものでもありません。詳しくは利用規約をご覧ください。