PROTECTED SOURCE SCRIPT
[DEM] Donchian Cloud
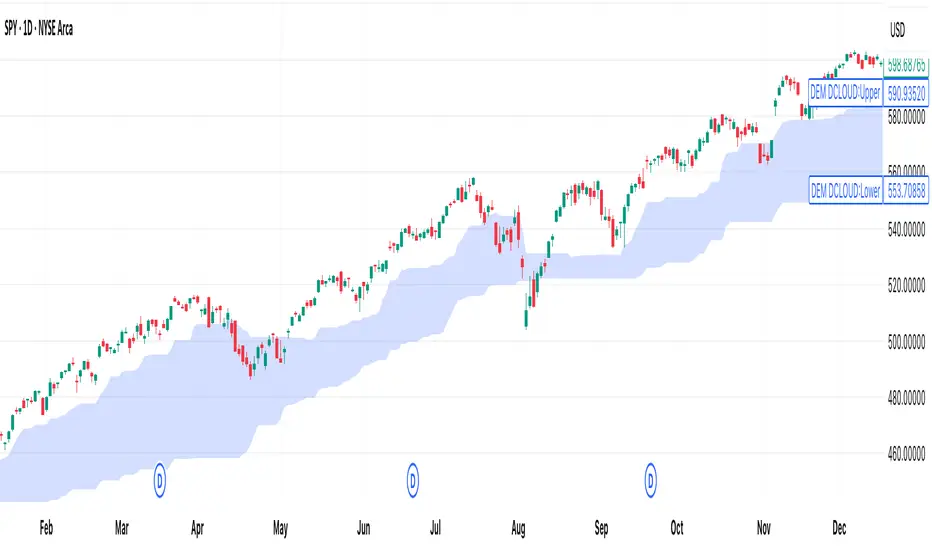
[DEM] Donchian Cloud is designed to create a visual cloud overlay on the price chart using two Donchian Channel midlines of different periods (26 and 117 bars) to identify trend direction and potential support/resistance zones. The indicator calculates the average of the highest high and lowest low for each period, plots these as nearly transparent blue lines, and fills the area between them with a color-coded cloud that changes from blue to red when the longer-period midline (117) crosses above the shorter-period midline (26), indicating a potential bearish shift in the longer-term trend. This cloud system helps traders visualize the relationship between short-term and long-term price equilibrium levels, with the cloud color providing a quick reference for overall trend bias and the cloud boundaries offering dynamic support and resistance levels.
保護スクリプト
このスクリプトのソースコードは非公開で投稿されています。 ただし、制限なく自由に使用できます – 詳細はこちらでご確認ください。
免責事項
この情報および投稿は、TradingViewが提供または推奨する金融、投資、トレード、その他のアドバイスや推奨を意図するものではなく、それらを構成するものでもありません。詳細は利用規約をご覧ください。
保護スクリプト
このスクリプトのソースコードは非公開で投稿されています。 ただし、制限なく自由に使用できます – 詳細はこちらでご確認ください。
免責事項
この情報および投稿は、TradingViewが提供または推奨する金融、投資、トレード、その他のアドバイスや推奨を意図するものではなく、それらを構成するものでもありません。詳細は利用規約をご覧ください。