INVITE-ONLY SCRIPT
(17) Trade Risk Management VS-427)
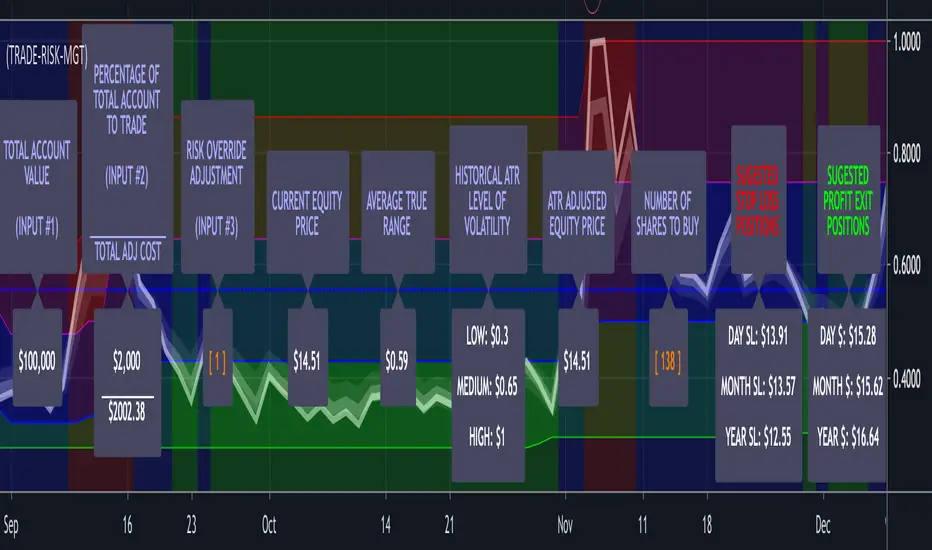
Trade Risk Management is an Average True Range (ATR) indicator and a Risk Management Worksheet combined. Think widget, spreadsheet or worksheet that calculates how much you should invest in any equity. This enables the trader to very quickly determine the level of volatility of any equity, allowing them to adjust their entry position size based on current and historical volatility . This is a simple and effective risk management tool. The trader only needs to enter the first three label values through the input/styles panel. Historical Volatility is determined via a 60 day/bar look-back for the highest high and the lowest low of the ATR. These two figures are utilized to stratify three background bands (Red = High Volatility; Blue = Median Volatility; and Green = Low Volatility.) The labels are then plotted on the center-line value representing the historical volatility of the equity in question. The label color represents the current volatility of the equity. This indicator is free to any subscriber of any Genie indicator package.
Enter the total value of all of your investments (stocks, cryptos, cash) in input #1 which will then be displayed in Label #1.
You enter the percentage of your account value you are willing to risk on any trade in input #2 which is then displayed in Label #2.
Input #3 allows you to override the built-in risk evaluation based on ATR. Label #3.
Label #4 shows the current equity trading price.
Label #5 shows the current ATR of the equity.
Label #6 shows three levels of historical volatility reflected in the three bands (RED, BLUE, GREEN) shown on the chart.
Label #7 shows the adjusted equity price based on current ATR. If the current ATR is High; Top Red Band, the amount is increased by the (ATR * Risk Factor) Adjustment. Because this increases you're calculated cost basis the number of shares you are indicated to buy is decreased, reducing your exposure to risk in a high volatility/risk environment. If the ATR is Low: Bottom Green Band, the amount is decreased by the (ATR * Risk Factor) Adjustment. Because this decreases your calculated cost basis the number of shares you are indicated to buy is increased because you are in a low volatility/risk environment. If the ATR is neutral: Middle Blue Band, the actual equity cost is utilized and no risk weighting based on ATR is incorporated.
Label #8 shows the resulting change in the price that the risk weighting calculation above had on current price.
Label #9 indicates the recommended number of Risk-Managed-Shares the trader should purchase.
Label #10 indicates the suggested Stop Loss levels and Label #11 shows the suggested Profit Exits Levels.
To further emphasize that the Labels are the Indicator, they get plotted on a line that plots at the center of the current volatility level. If you bring up this indicator and run through one of your trading symbol list, it will enable you to immediately determine exactly what the level of current and historical volatility each of the equities in your list is experiencing.
Additionally, the color of the text on all of the descriptive labels plotted above the center line change color based on the current level of volatility.
Access this Genie indicator for your Tradingview account, through our web site. (Links Below) This will provide you with additional educational information and reference articles, videos, input and setting options and trading strategies this indicator excels in.
招待専用スクリプト
このスクリプトは作者が承認したユーザーのみアクセス可能です。使用するにはアクセス申請をして許可を得る必要があります。通常は支払い後に承認されます。詳細は下記の作者の指示に従うか、StockSwingerに直接お問い合わせください。
TradingViewは、作者を完全に信頼し、スクリプトの動作を理解していない限り、有料スクリプトの購入・使用を推奨しません。コミュニティスクリプトには無料のオープンソースの代替が多数あります。
作者の指示
免責事項
この情報および投稿は、TradingViewが提供または推奨する金融、投資、トレード、その他のアドバイスや推奨を意図するものではなく、それらを構成するものでもありません。詳細は利用規約をご覧ください。