PROTECTED SOURCE SCRIPT
Relative Strength Index Exin + ADX
Hello friends, I wish you all the best.
Relative Strength İndex + Adx coding.
I'd like to talk a little bit about how it works
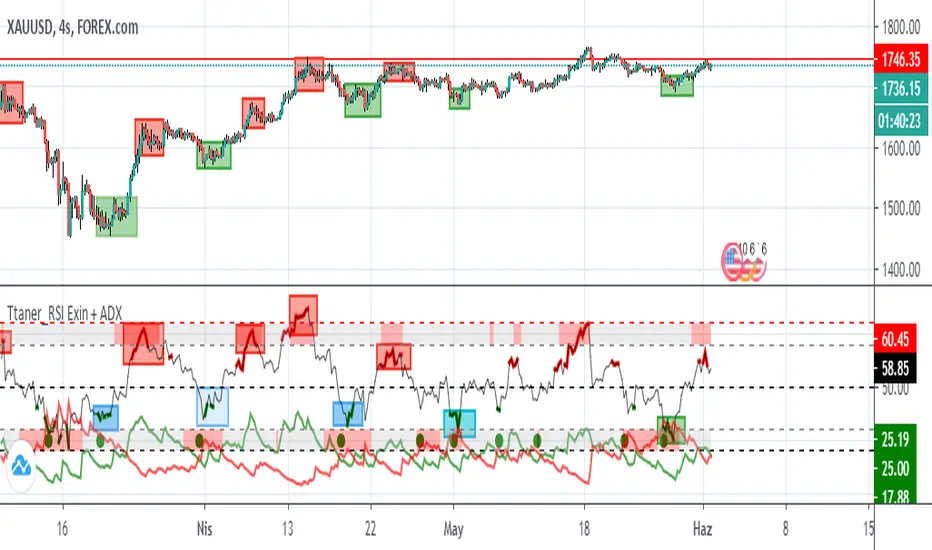
We can say that the ascension action begins when the green line rises above the red line
you can measure the success rate of this indicator from the past.
RSI The green dots at the bottom show reception.
RSI The red dots on the top indicate that sales may come.
RSI means purchase when the bottom is green
When the RSI top line turns red, it means sales
If my sharing has helped you, you can like and support it. Stay tuned to be notified of new analysis and indicators
Relative Strength İndex + Adx coding.
I'd like to talk a little bit about how it works
We can say that the ascension action begins when the green line rises above the red line
you can measure the success rate of this indicator from the past.
RSI The green dots at the bottom show reception.
RSI The red dots on the top indicate that sales may come.
RSI means purchase when the bottom is green
When the RSI top line turns red, it means sales
If my sharing has helped you, you can like and support it. Stay tuned to be notified of new analysis and indicators
保護スクリプト
このスクリプトのソースコードは非公開で投稿されています。 ただし、制限なく自由に使用できます – 詳細はこちらでご確認ください。
免責事項
この情報および投稿は、TradingViewが提供または推奨する金融、投資、トレード、その他のアドバイスや推奨を意図するものではなく、それらを構成するものでもありません。詳細は利用規約をご覧ください。
保護スクリプト
このスクリプトのソースコードは非公開で投稿されています。 ただし、制限なく自由に使用できます – 詳細はこちらでご確認ください。
免責事項
この情報および投稿は、TradingViewが提供または推奨する金融、投資、トレード、その他のアドバイスや推奨を意図するものではなく、それらを構成するものでもありません。詳細は利用規約をご覧ください。