PROTECTED SOURCE SCRIPT
[DEM] MACD Bars
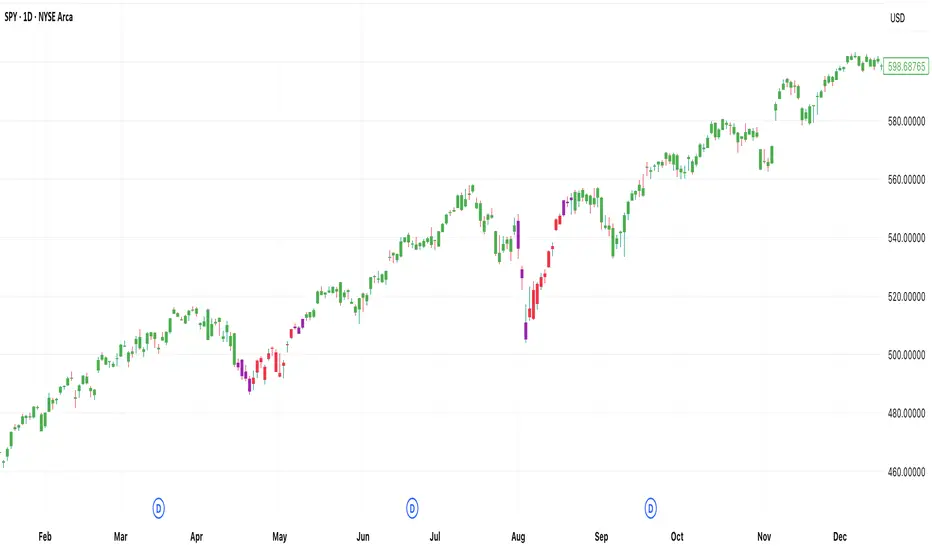
[DEM] MACD Bars is designed to color price bars based on the relationship between the MACD line and its histogram to provide immediate visual feedback about momentum conditions and potential trend changes. The indicator calculates the standard MACD using the default parameters (12, 26, 9) and applies a three-color system to the candlesticks: green bars when the MACD line is above both the histogram and zero (indicating strong bullish momentum), red bars when the MACD line is below both the histogram and zero (indicating strong bearish momentum), and purple bars for all other conditions where momentum signals are mixed or transitional. This color-coding system helps traders quickly identify periods of strong directional momentum versus periods of uncertainty or potential reversal without needing to reference a separate MACD indicator pane.
保護スクリプト
このスクリプトのソースコードは非公開で投稿されています。 ただし、制限なく自由に使用できます – 詳細はこちらでご確認ください。
免責事項
この情報および投稿は、TradingViewが提供または推奨する金融、投資、トレード、その他のアドバイスや推奨を意図するものではなく、それらを構成するものでもありません。詳細は利用規約をご覧ください。
保護スクリプト
このスクリプトのソースコードは非公開で投稿されています。 ただし、制限なく自由に使用できます – 詳細はこちらでご確認ください。
免責事項
この情報および投稿は、TradingViewが提供または推奨する金融、投資、トレード、その他のアドバイスや推奨を意図するものではなく、それらを構成するものでもありません。詳細は利用規約をご覧ください。