OPEN-SOURCE SCRIPT
更新済 [dharmatech] U.S. Treasury Yield Curve
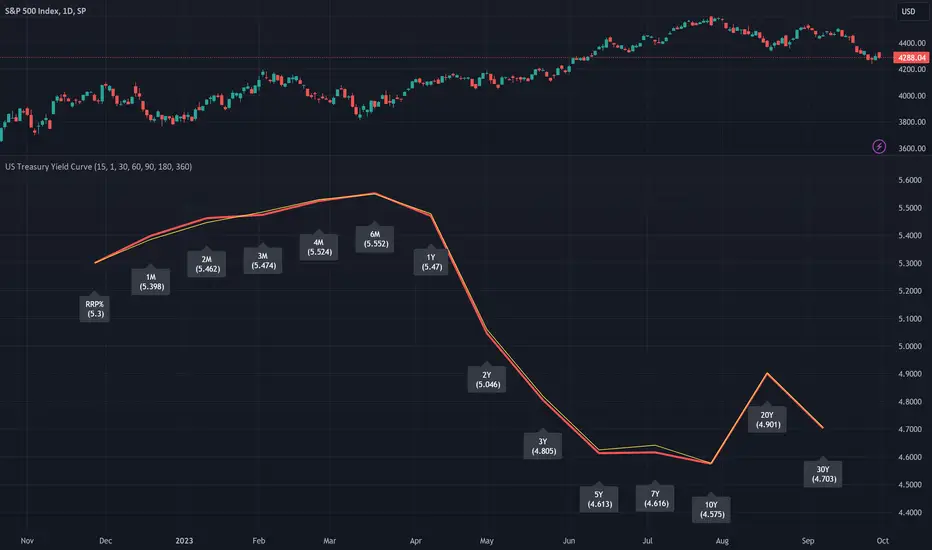
This indicator displays the U.S. Treasury Securities Yield Curve.
This is a fork of the US Treasury Yield Curve indicator by @longflat. Thank you for sharing your work!
There are already so many yield curve indicators on TradingView.
What makes this one different?
Update to version 5 of Pine Script
Add RRP%
Add 4 month
Add 20 year
Show previous day's yield curve
Options for prior yield curves
The thick red line shows the latest yield curve.
The yellow line shows the yield curve 1 bar ago.
So, if your timeframe is set to 1 day, the yellow line will show yesterday's yield curve.
リリースノート
Hardcoded timeframe of securities to 1D.Without this, RRP doesn't load at lower timeframes.
Also, without this, at lower timeframes, the yield curve difference is sometimes hardly noticeable.
オープンソーススクリプト
TradingViewの精神に則り、このスクリプトの作者はコードをオープンソースとして公開してくれました。トレーダーが内容を確認・検証できるようにという配慮です。作者に拍手を送りましょう!無料で利用できますが、コードの再公開はハウスルールに従う必要があります。
免責事項
この情報および投稿は、TradingViewが提供または推奨する金融、投資、トレード、その他のアドバイスや推奨を意図するものではなく、それらを構成するものでもありません。詳細は利用規約をご覧ください。
オープンソーススクリプト
TradingViewの精神に則り、このスクリプトの作者はコードをオープンソースとして公開してくれました。トレーダーが内容を確認・検証できるようにという配慮です。作者に拍手を送りましょう!無料で利用できますが、コードの再公開はハウスルールに従う必要があります。
免責事項
この情報および投稿は、TradingViewが提供または推奨する金融、投資、トレード、その他のアドバイスや推奨を意図するものではなく、それらを構成するものでもありません。詳細は利用規約をご覧ください。