INVITE-ONLY SCRIPT
Trend Cloud Performance - TradingED
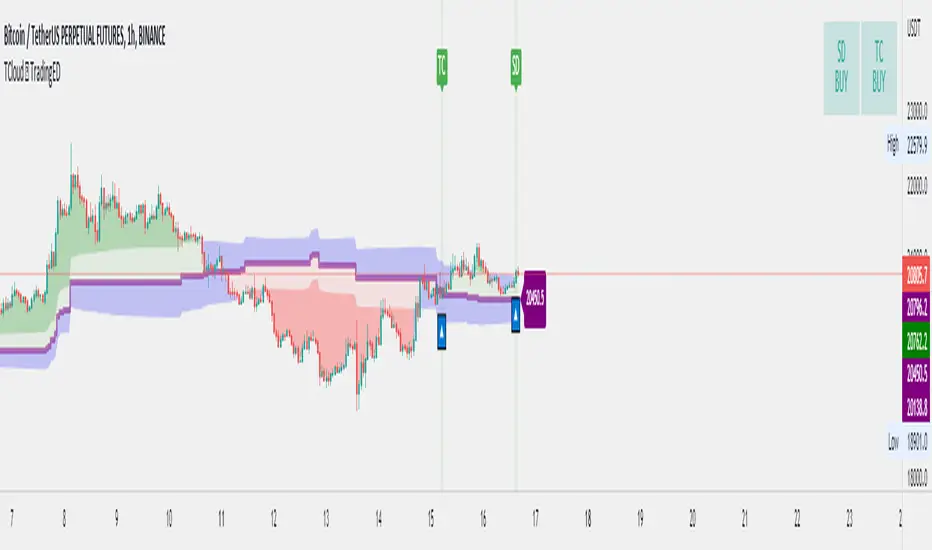
This case study is based on a Price Level Average as in Donchian Channels but with a Variance Level (aka Standard Deviation), and a performance chart. The use of this indicator is restricted to private use, and it can be used only by invitation. Different functionalities have been added to the original code, such as alerts and signals that seek to make trading much easier to interpret by any type of trading operator of any experience level, from beginner to intermediate and advanced.
Key components of the original indicator:
• Donchian Channels are a technical indicator seeks to identify bullish and bearish extremes that favor reversals as well as higher and lower breakouts, breakdowns, and emerging trends.
• The middle band simply computes the average between the highest high over N periods and the lowest low over N periods.
• These points identify the median or mean reversion price.
Donchian Channels are three lines generated by moving average calculations that comprise an indicator formed by upper and lower bands around a midrange or median band.
The center line identifies the median or mean reversion price for the period, highlighting the middle ground achieved for the period through the bull-bear conflict. The bottom line identifies the extent of bearish energy, highlighting the lowest price achieved for the period through the bull-bear conflict.
Main functions of this modified indicator:
1) The SOURCE for the count can be determined by the trader (close, open, etc).
2) The MEASURE can be based on a CANDLES count if you are trading OHLC Charts from 1D onwards, or if your trading is intraday, you can also select counts by MINUTES, HOURS or DAYS, depending on your trading style.
3) LENGTH, by default it will be loaded as 20 but considering the previous point, you can modify it according to your convenience.
4) STANDARD DEVIATION, by default it will come loaded with 2 deviations, but you can modify it according to your convenience to operate.
6) You have the option to hide or show a LABEL at the top of the chart, with respect to the signals: bullish green, bearish red.
7) You have the option to hide or show SIGNALS based on the MOVING AVERAGE that you have previously chosen.
8) You have the option to hide or show SIGNALS based on the STANDARD DEVIATION that you have previously chosen.
Main functions to customize the style of this indicator:
a) You can select the colors for the UPPER BAND, MOVING AVERAGE and LOWER BAND depending on the trend, whether it is BEARISH or BULLISH , with the colors that best suit you. *
b) When you have a SHORT SIGNAL or a LONG SIGNAL, you can change the EMOTICON that comes by default. **
c) For any type of SIGNAL, it is painted as a VERTICAL LINE in the graph, you can change the color that comes by default. *
d) In the case of the LABELS that appear at the top, the text is not modifiable, but you can customize both the type of label and change the default color. *
e) You can select the colors for the BACKGROUND of the indicator according to the trend, whether it is BEARISH or BULLISH, with the colors that best suit you. *
* By default, they are marked as red for downtrends and green for uptrends.
** By default, they are marked with an emoticon indicating the possible direction of the price, down if it is bearish or up if it is bullish.
招待専用スクリプト
このスクリプトは作者が承認したユーザーのみアクセス可能です。使用するにはアクセス申請をして許可を得る必要があります。通常は支払い後に承認されます。詳細は下記の作者の指示に従うか、Trading_EDに直接お問い合わせください。
TradingViewは、作者を完全に信頼し、スクリプトの動作を理解していない限り、有料スクリプトの購入・使用を推奨しません。コミュニティスクリプトには無料のオープンソースの代替が多数あります。
作者の指示
Send DM for access instructions.
We are a community of Traders interested in applying adequate Risk Management for Financial Markets.
免責事項
この情報および投稿は、TradingViewが提供または推奨する金融、投資、トレード、その他のアドバイスや推奨を意図するものではなく、それらを構成するものでもありません。詳細は利用規約をご覧ください。