INVITE-ONLY SCRIPT
更新済 TM_DAY_TRACKER_SUPER_SPECIAL
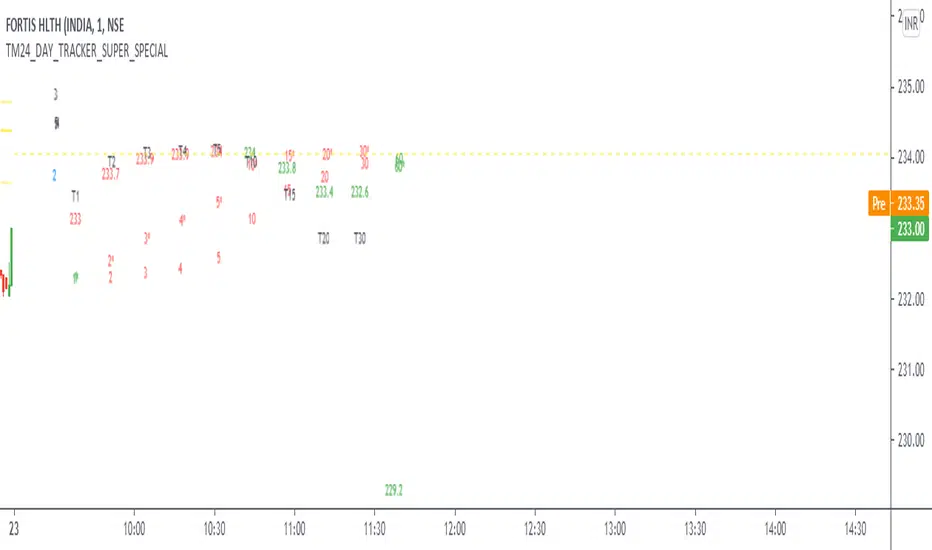
TM_DAY_TRACKER_SUPER_SPECIAL Indicator shows overall trend or market direction for Intraday / Swing Position along with Buy or sell signal.
Terminology Use ==> B- Buy, S- Sale Signal, and Numbers are to show time frame indication there is presence of buyer or seller like B1 for buy signal on 1 minute time frame etc.
Display and Interpretation ==> Buy Sale Signal in B/S , Digit with 1-3-5-10-15-30-60-D for different time frames, Value with Triangle mark shows possible direction of momentum
This indicator help to identify 4 major things:-
1. Area of order Buildup
2. Price Strength
3. Direction
4. Volatility
Time frame ==> Use proper Signal with swing trend on 1 minute, 3 minute 5 minute, 15 minute time frame
What to Identify ==> Overall Trend for the intraday and swing Period
How to Use ==>
See how and order buildup is seen and current order position. Also area for volatility and expected movement in price direction
Note: - Use market structure, chart pattern, trend lines and price action parameter for more confirmation.
Entry ==>
Let’s wait the proper area of support or resistance ( Area of Value in case of trend pattern use)
Exit ==>
SL of swing high/low out of market structure with proper risk management and target with proper Risk/ Reward Ratio
Use the Below Contacts to Access this Indicator
リリースノート
Updatesリリースノート
Updatesリリースノート
Updatesリリースノート
Updateリリースノート
Updateリリースノート
Updates招待専用スクリプト
このスクリプトは作者が承認したユーザーのみアクセス可能です。使用するにはアクセス申請をして許可を得る必要があります。通常は支払い後に承認されます。詳細は下記の作者の指示に従うか、TradingMind24に直接お問い合わせください。
TradingViewは、作者を完全に信頼し、スクリプトの動作を理解していない限り、有料スクリプトの購入・使用を推奨しません。コミュニティスクリプトには無料のオープンソースの代替が多数あります。
作者の指示
Regards
Trading Mind
Use the Below Contacts to Access this Indicator
Contact Form:-https://forms.gle/qwStQRp7hvv98D4g8
Email Us- tradingmind24@gmail.com
Whatsapp :- +91-
Telegram:- https://t.me/tradingmind24
免責事項
この情報および投稿は、TradingViewが提供または推奨する金融、投資、トレード、その他のアドバイスや推奨を意図するものではなく、それらを構成するものでもありません。詳細は利用規約をご覧ください。
招待専用スクリプト
このスクリプトは作者が承認したユーザーのみアクセス可能です。使用するにはアクセス申請をして許可を得る必要があります。通常は支払い後に承認されます。詳細は下記の作者の指示に従うか、TradingMind24に直接お問い合わせください。
TradingViewは、作者を完全に信頼し、スクリプトの動作を理解していない限り、有料スクリプトの購入・使用を推奨しません。コミュニティスクリプトには無料のオープンソースの代替が多数あります。
作者の指示
Regards
Trading Mind
Use the Below Contacts to Access this Indicator
Contact Form:-https://forms.gle/qwStQRp7hvv98D4g8
Email Us- tradingmind24@gmail.com
Whatsapp :- +91-
Telegram:- https://t.me/tradingmind24
免責事項
この情報および投稿は、TradingViewが提供または推奨する金融、投資、トレード、その他のアドバイスや推奨を意図するものではなく、それらを構成するものでもありません。詳細は利用規約をご覧ください。