PROTECTED SOURCE SCRIPT
Power Momentum by Atilla Yurtseven
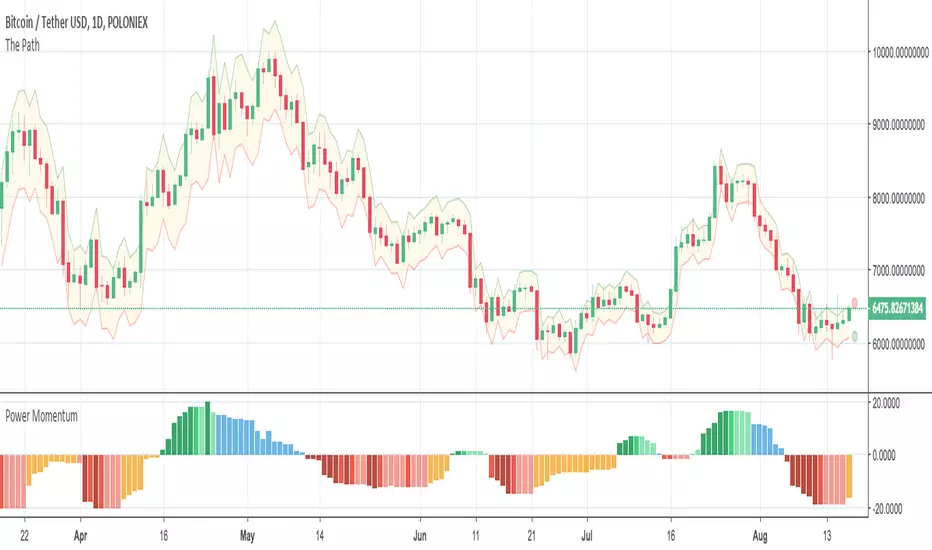
The Power Momentum indicator calculates momentum in a different way. The graph may look similar. The important part is the color of the bars.
If you set the "Base Line" to "Zero", there are two important things to notice. The orange color when the bars are below the base and the blue color when the bars are above the base.
If you set the "Base Line" to "Stats", instead of coloring bar, you see the bars in exact positions. For example; "Zero" shows you orange bar below the base line but "Stats" shifts the bars over the Base line.
Momentum is calculated statistically. If the momentum moves over to the preset levels, bar colors change concurrently.
BAR STATES
Orange: Orange bar below the base line means high possibility of an upcoming up movement
Blue: Blue bar above the base line means high possibility of an upcoming down movement
I hope you enjoy this indicator. As I stated in my previous indicators, i use statistical methods while developing my indicators.
Disclaimer: All the information in this article, including the indicator, was provided and published for informational purposes only and should not be considered legal or financial advice. Please use at your own risk.
Please remember to follow me and post some comments so i can share more indicators.
Happy trading! :)
Atilla Yurtseven
保護スクリプト
このスクリプトのソースコードは非公開で投稿されています。 ただし、制限なく自由に使用できます – 詳細はこちらでご確認ください。
I know Kung-Fu!
免責事項
この情報および投稿は、TradingViewが提供または推奨する金融、投資、トレード、その他のアドバイスや推奨を意図するものではなく、それらを構成するものでもありません。詳細は利用規約をご覧ください。
保護スクリプト
このスクリプトのソースコードは非公開で投稿されています。 ただし、制限なく自由に使用できます – 詳細はこちらでご確認ください。
I know Kung-Fu!
免責事項
この情報および投稿は、TradingViewが提供または推奨する金融、投資、トレード、その他のアドバイスや推奨を意図するものではなく、それらを構成するものでもありません。詳細は利用規約をご覧ください。