PA Extremely Early version
Experimenting with traditional "market structure" and candlestick patterns for trend analysis
ATR

HMA_ATR_TSIA combination of signals trigger this strategy.
HMA crossovers (short period & long period) -Hull moving average-
ATR (smoothed with HMA ) -Average true range-
TSI -True strength index-
The final close price is not known until right at the end of the bar.
This means that the indicator is constantly “repainting” during the bar.
You will see that indicators are constantly moving with each tick received
Use Open instead, the value is set and does not change even after refreshing the page.
An attempt to reduce repainting.
INDICATOR VERSION FOR USE WITH ALERTS

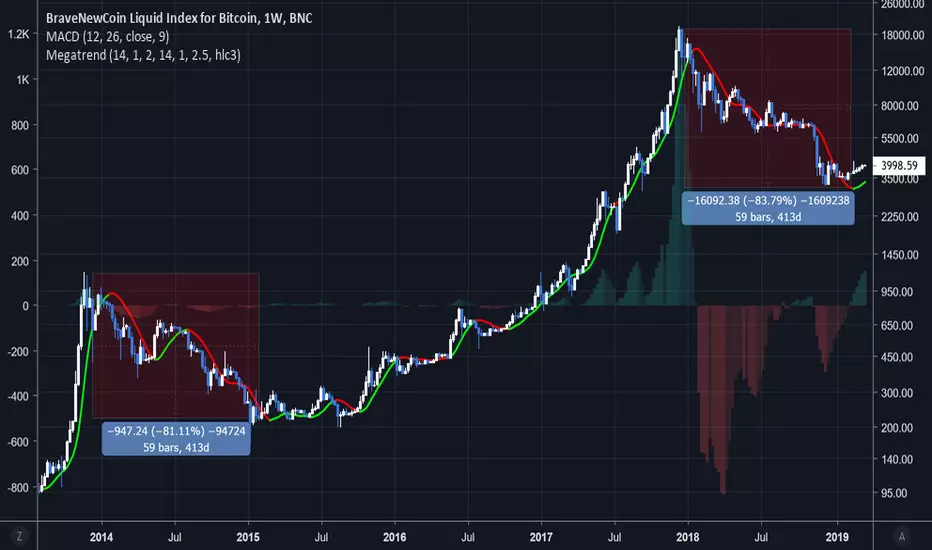
Megatrend Alerts — SharkCIAThis method of trend analysis uses breakouts from the Average True Range to determine if an instrument is bullish or bearish.

AG ATR ImpulseThis is an indicator we built to look for "Impulse" moves in the markets. It uses Average True Range (ATR) calculations. We use a fastATR setting of 1 to show the current candle/period's ATR. The black line is a second, slowATR, that we use to see whether the fastATR is higher than the slowATR. If so, the bar is green, if not, grey.
The background is coloured by a "Change Factor" that can be customised. It essentially uses more ATR calculations to suggest whether to be looking for longs (green background) or shorts (red background). Setting the Change Factor lower than default to 1 makes the underlying calculations more sensitive, and thus, the background filter will change more often, but the signal will have less accuracy. Setting the Change Factor higher than default to, say, 3, will make the underlying calculations less sensitive, and thus, the background filter will change less often, but the signal will be more accurate.
In the chart example attached, I have included some trade ideas that could have been taken using this indicator to give you an idea of how to use the indicator.

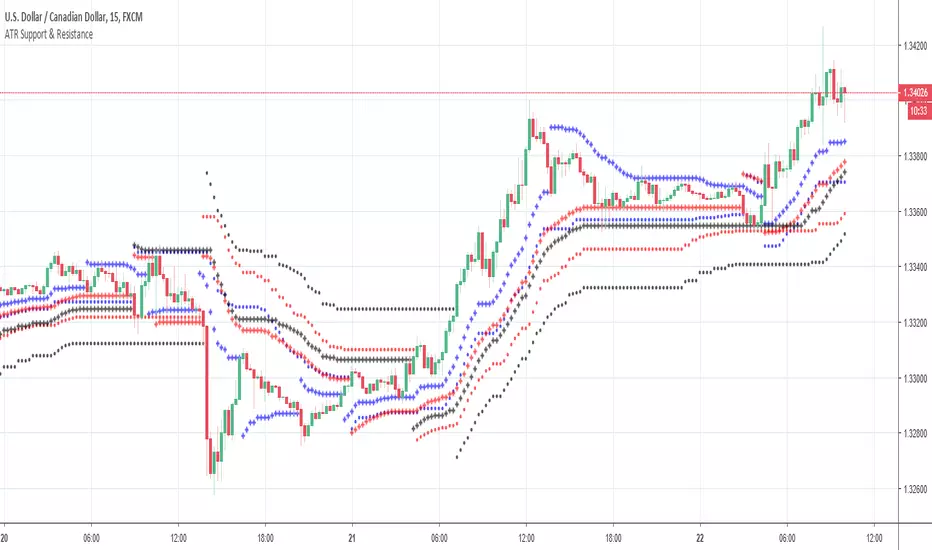
THD ATR Support & ResistanceThe TradersHelpDesk ATR Support & Resistance indicator identifies the support and resistance based on average true range for multiple timeframes. For more information, click here.
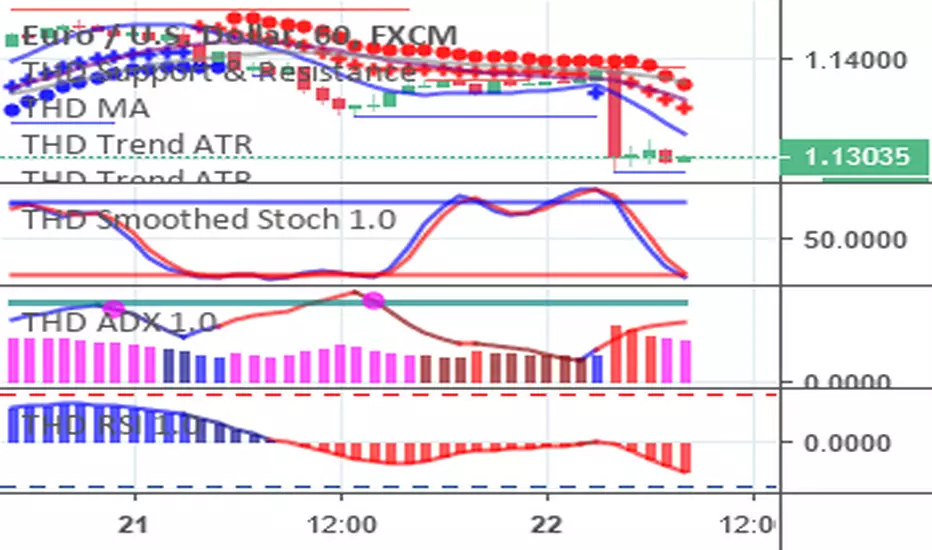
THD Trend ATRThe THD Trend ATR identifies current trend (blue for uptrend, red for downtrend) and support and resistance using the average true range stop algorithms. The lowest point of risk is always at the ATR (either the plus signs or the dots). Simply wait for a bar in the direction of the trend to form (bullish for an uptrend and bearish for a downtrend).
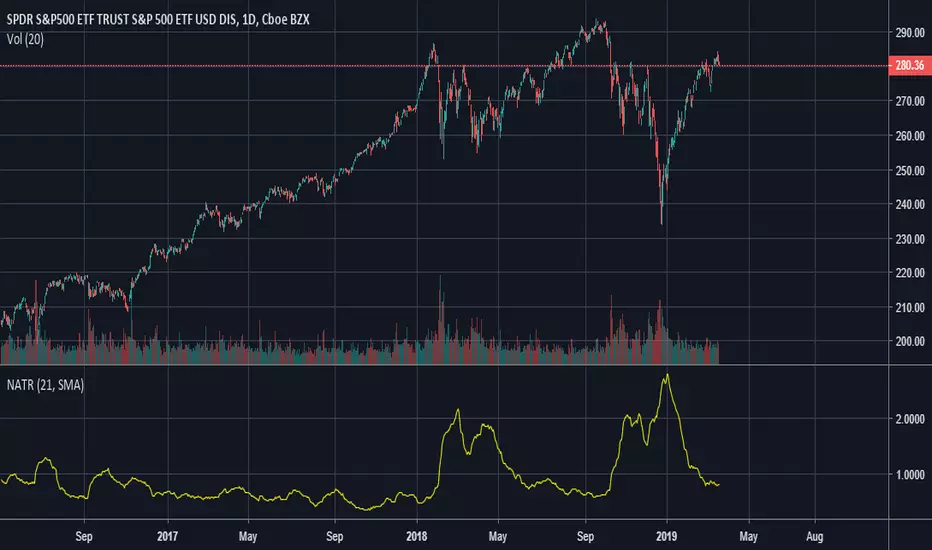
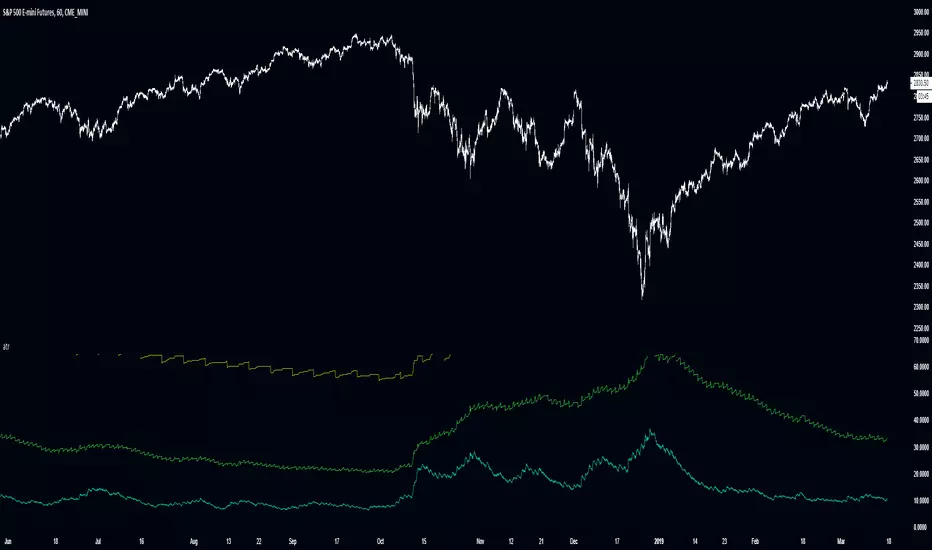
Normalized Average True RangeThis is a Normalized ATR, which means it displays ATR as a percentage instead of absolute price. For example, a value of 1 indicates a true range of 1% in a given period.
This indicator creates a moving average of the volatility of a product going back X number of periods and is useful for deciding what to trade. For example, if used on a daily chart, one product displays a value of 4 you can reasonably expect it to have larger price swings and movement compared to another product that displays 1.
It does not predict direction, rather the size of moves.
ATRMSRATRMSR
MTF ATR Horizontal S/R deviations
MTF ATR trailing stops
MTF ATR High/low
Will be updated soon.
V.01

Improved Multi-Timeframe (MTF) 21 ATR - plots same as live dataThis multi-timeframe 21-period average true range uses an improved calculation to accurately calculate the indicator's value with every new bar on the time frame your chart is set to. Previously the indicator only recalculated with every new update on the timeframe used in its security function. This means that this improved script plots the real, current value of your indicator across your chosen timeframes on your chart's resolution and no longer only plots only the indicator's monthly/weekly/daily/4 hour/ect closing value on the your chart.
Input values are fixed to their default (close,21) configuration to make this indicator's improved calculation possible.
When using "Plot Higher Timeframe?" the script will set the indicator to only plot its value in closest larger timeframe. This option overrides the two following options. For example, when using the daily resolution , only the weekly value will plot, or when using the one hour (60m) resolution, only the 4 hour (240m) value will plot.
The "Omit Higher Timeframes?" option will set the indicator to only plot starting from the 1/2/3/4/5/6/7th closest larger timeframe. For example, when using the daily resolution and this option set to 0, all values from the weekly resolution and up will plot, but if set to 1, all values from the monthly resolution and up will plot instead.
The "Plot Yearly/Quarterly/Monthly/Weekly/Daily/4 Hour/1 Hour/15 Minute/5 Minute?" options allow enabling/disabling a specific timeframe. All are enabled by default. For example, if you do not want the yearly value of the indicator to ever plot, you can disable the "Plot Yearly?" option.
Basecamp AutoFibAutomatic Fibonacci Support and Resistance derived from the recent Average True Range.
This tool is used as a guideline for where mathematically evident support and resistances are estimated to be.
Unlike typical methods, this will adjust as candles print and the ATR expands or contracts assisting the user in ensuring realistic price targets relative to the current movement.

True Range AutoFibAutomatic Adjusting Fib Support and Resistance
Adjustable Candle Length Average True Range centered on the 34 MA Fibonacci Support and Resistance lines for all timescales on all instruments.
**These lines do move as candles print adjusting slowly to the changing ATR. This generally should indicate the realistic expected move for the current time frame.

RSI-ATR Divine StrategyLive, non-repainting strategy using ATR and RSI mixed together to take long and short positions. Includes:
Live entry direction with trade warnings and alerts
Live trade building buy and sell stops (for buy/sell stop limits)
Entry location icons as well as pyramid entries (to add to existing position)
3 separate targets based on the ATR setting and entry location
2 separate trailing stops, 1 for "absolute stop" and 1 for "take profit stop"
Alert conditions for every update and condition change of the strategy
4 pre-built color themes, including candlestick coloring
This strategy is best used with my RSI Shaded Indicator using the identical RSI settings.

Manual Back Test LinesI created this indicator to primarily manually test other indicators in replay mode.
To use this indicator generally you will:
Select trade type: long or short
Enter your ATR (enter the actual ATR). The indicator will then calculate and plot your SL and targets based on your values
Default Stop Loss is ATR * 1.5
Default Target 1 is ATR * 1.5
Default Target 2 is ATR * 3
Using this indicator on Replay mode is great. What you do is go back in time. Hit play and as the indicator(s) you use provide signals pause.
Pull up options:
Select trade type
Update ATR value
Change date to entry date. Typically if you are trading off the daily timeframe you are going to wait for your current day candle to close to provide signal. That would mean your entry would be on the next day.
Click play and watch, track and record how trade unfolds.
Future updates:
I'd like to be able to have some way to click one button and have it fire that enter trade right now on chart. Also I'm working on figuring out how to calculate the ATR on the entry date so that isn't required to be entered.
Finally, I'd like to have some auto calculation on when targets and SL are hit. I have this partially done but it's more important that I use this indicator than spend time or funds to update it to do that. But I do plan on updating.

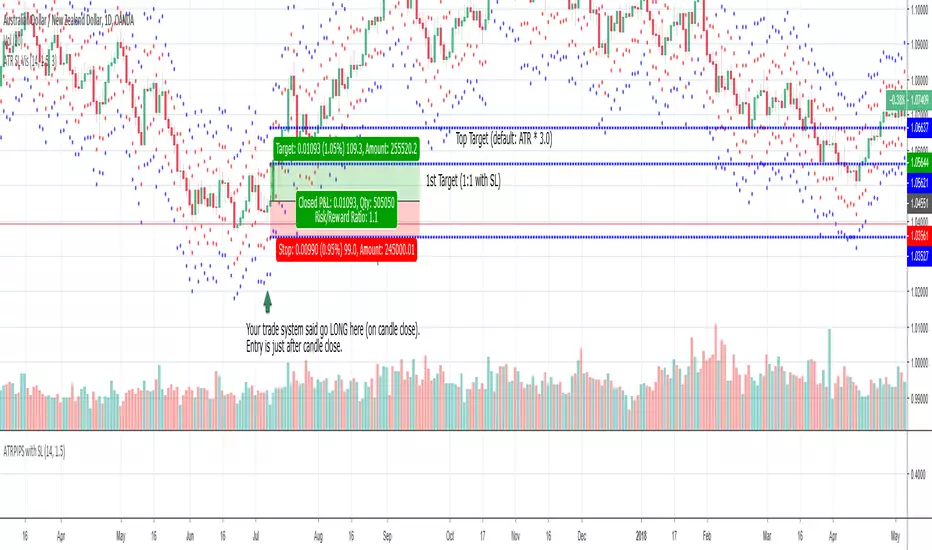
ATR SL Visualization (on chart)This indicator plots 2 sets of dots (and lines) based on your chosen ATR multiplier (Average True Range).
Generally, when trading on the daily timeframe a good rule of thumb is to use the ATR * 1.5 (the default setting of this indicator).
I created this indicator to quickly test other indicators but I also find it helpful in live trading.
How to use this indicator:
Your trade system provides an entry signal. The red dot (can be connected line in options) would be used as the stop loss for either a long or short.
Then the dot on the other side would be your first 1:1 target.
The blue line is the same ATR multiplier as a target (default but can be modified).
Using an additional tool like the horizontal ray can be helpful to see the exact location the SL might be hit or where the target might hit.
When drawing your ray ensure you’re using the right entry candle.
For instance, in a long scenario you would typically be entering a trade after your signal candle closes. So draw the ray at the point in price on the next candle for both stop loss and target.
Also use these dots (lines) as guides provides an easy way to plot SL and targets if you want to use the Long or Short tool.
For my trade systems I don’t use price targets (I exit when structure or indicators reveal to exit) but I do find it helpful to graph when testing. When something moves in my favor either the ATR or the ATR * 1.5 I take profit and typically move up my stop loss to break even or trailing.
The other strategy that could be possible but have not tested is as long as the SL is making a new high moving up a hard stop to the ATR SL each day the trade goes in your favor.
This should be obvious but if you want to use just the true ATR edit the multiplier to be 1.0
ALMA Hurst Cycles - Potential Pivot points.Experiment in finding potential pivots using using multiple period volatility measurements (ATR) and ALMA.
------------------------------------------------------------------------------------------------------------------------------------
Warning!!! Must be tuned to obtain a good price fit for your time frame and instrument (and probably general market conditions). Default settings are only eyeball fit for XBTUSD 5M
So proper write up for a change :p
So a single ATR measurement say ATR(5) doesn't give much information alone, it doesn't give us direction for example. However if we plot a MA (in this case the Arnaud Legoux MA) and plot bands which are a multiple of the ATR around the MA we get a potential trading range based on recent volatility.
The assumption being that if volatility remains approximately the same AND if price moves beyond this ATR range it is highly probable to result in a reversion to the mean. Having reached the limit of recent volatility, available buying/selling pressure is exhausted and price pivots from that point back to the mean.
Now, if we plot multiple MA's of different lengths, they alone don't tell us too much alone either. But we also find reversions to the mean occurring between say a long and short MA. The short MA will rise above/below the long MA, return to the mean etc creating crossovers.
So we combine the two concepts. Three different length MAs with corresponding ATR lengths. The smallest band cycles above/below the median of the medium band (diverging from and reverting to the mean) and the medium band cycles above/below the median of the large band.
We want to find extreme points where a pivot is probable. The small band "bounces" or cycles back and forth within the medium band and the medium band "bounces" or cycles back and forth within the large band. Approximate short, medium and long trading ranges relative to MAs.
So for example and theoretically when the small band cycles to the top of the medium band AND the medium band cycles to the top of the large band and the price has risen above all of them, there is a high probability of there being a reversal.
So here's the interesting bit. There is far more going on than is immediately apparent. If you take the bands and normalize them (ie you pulled the median, upper and lower bands so they're straight horizontal lines), the price's position relative to the bands would give you something very, very close to an RSI.
The bands effectively give you three different length RSI's. When price exceeds all three bands is roughly equivalent to seeing the confluence of overbought/sold on three different length RSI's.
However unlike RSI, we also get an approximate trading range and price levels that that RSI would have to reach to indicate it is overbought/sold that takes into account recent volatility.
------------------------------------------------------
Caveats :
Similar to RSI downsides. Multi leg pumps/dumps can remain overbought/sold and give false signals.
Extended, narrow and declining ranges/ squeezes don't require much change in price action to trigger false signals.
Performs the best when ranging.
------------------------------------------------------
Signals and Bar Colors :
Bar colors (optional in settings) :
Green - Short MA > Medium MA > Long MA
Red - Short MA < Medium MA < Long MA
Three "tiered" signals:
Large triangles. High probabilty pivot. Price exceeded all bands at the top/bottom.
Medium triangles. Price exceeded the small and medium bands, DIDN'T exceed the large band AND the small band HAS exceeded the medium band.
Small triangles. Price exceeded the small and medium bands, DIDN'T exceed the large band AND the small band DIDN'T exceed the medium band.

Average True Range (ATR %) Stop Loss CalculatorThis indicator takes the average of a series of ATR to calculate what I would consider an optimum stop loss placement represented in percentage (read below for full overview).
While the data is plotted what is most helpful are the actual numbers presented and for my charts I remove most of the plotting.
This indicator is most helpful on the daily timeframe but can be used for all timeframes such as the 4HR, 1HR or even 15M.
This indicator should not be used alone. It should be used in conjunction with proper price action analysis. It’s also a great indicator if you chart using Value Channels. Ideally you want your stop placement to be below at least one core Value Channel boundary range. In addition to standard support and resistance and some key moving averages the market respects. This also works best when trading with the prevailing BIAS of the instrument (bull or bear).
Cryptos: Generally, that means you’re buying on retracements that fit the end of a structured move. The other option is using this in a clear up trending market where the pull backs are clearly being supported with buying.
FOREX: I built another indicator for FOREX search: ATRPIPS with SL
WTI: Helpful but I have different rules for when I trade WTI. I rely upon VCs and diagnal VCs much more when trading this.
Equities: Helpful but with the increase of volatility as well as uncertainty of Bias of the market-- this should be used as more of a guide than
What is most important is the actual percentage numbers but I've found graphing 1-3 of the actual ATRs is helpful. The rest just uncheck the checkbox in the options.
Indicator Overview:
Value 1 - 3 Period ATR (maroon)
Value 2 - 7 Period ATR (green)
Value 3 - 30 Period ATR (blue)
Value 4 - 90 Period ATR (blue, bold)
Value 5 - 1 Period ATR (green)
Value 6 - 1 Period ATR (red)
Value 6 – Prime Stop Loss Placement (maroon). This is the average of all above ATRs multiplied by 1.5
Value 7 - Move Left (red). Experimental value. This is the difference between (prime stop loss) and 1 day period move. Two ways to use this value. Use as a tighter stop loss placement. The other option is to use as a retrace target for purchase and using the Prime Stop Placement value as you’re stop loss.
All ATRs use the LOW price of the period. After testing both the low and close I’ve settled on the low to capture the most volatility you will typically experience.
Once again, this indicator should be used in conjunction with your proven trade system.
Also, by knowing what the values are within the indicator you could just eye ball what would be the best stop placement depending on the ATR or 1 or 2 ATRs you find most represent the volatility of what you are trading.
I will be expanding on this indicator by bringing in average measured moves as well as volume analysis and most likely with color changes and modifications.
Background:
While using and refining my trade system I've noticed that most moves happen in 3 periods. So we start there. The 7 period is good for a 24 hour market such as crypto (although weekend trading can be a hit or miss) and to some extent FOREX. The longer periods of 30 & 90 are to smooth out the data set. The final value of the 1 period is to bring a little more recency to the calculation.
Why multiply the average by 1.5? I've found in my own trading and system I built to be the best placement (in conjunction with VCs) to ensure you're stop isn't to close and is within the instrument you are trading volatility .
I'm looking at making this more intelligent as well as take into account volume and structured moves.

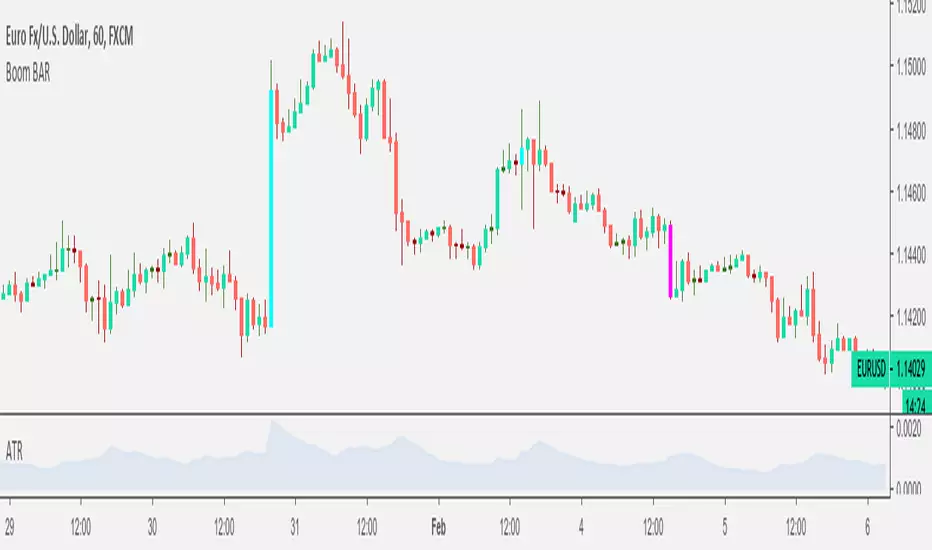
Boom BARThis script highlights the candles that have an explosion in movement by coloring them yellow. You can choose the percentage of amplitude over the ATR.
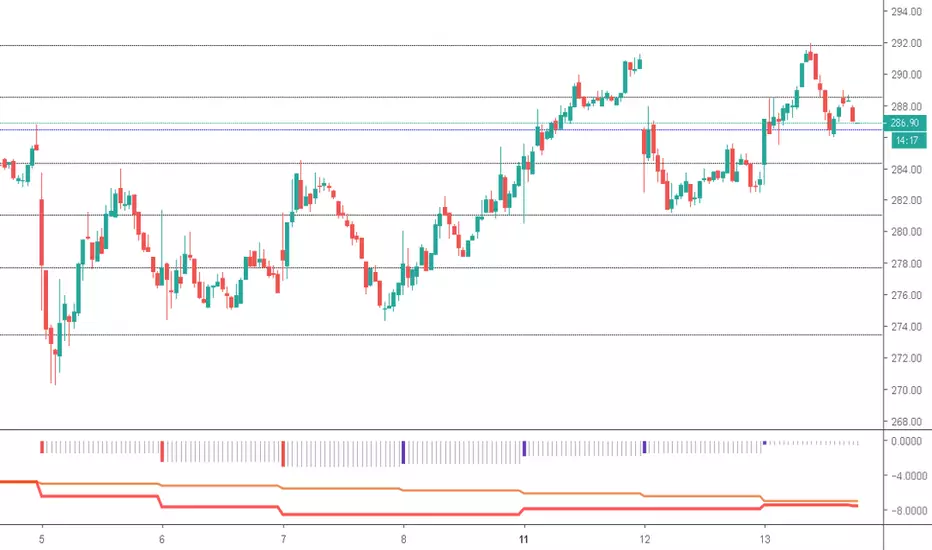
ATR Pips with Stop LossThis indicator shares ATR pips and a calculated 1.5 x stop loss calculation.
1st number is ATR.
2nd number is ATR x 1.5 (a typical SL when trading daily time frame).
The plot lines are really not that important- it's the actual numbers.
What I do is uncheck the plot line checkboxes (ATR & SL) so it doesn't show up, that way I can reduce the indicator window.
This script is a modified script by ATR Pips . Kept the BB section for now as it might be useful, but doubt it.
Future updates:
- editable the multiple for SL
- static daily numbers (right now this shows the timeframe you are viewing, I'd keep that but add a static daily ATR so you have both)

ATR+VWAP Alert//These signals mostly consist of crossovers between a 13 VWMA and a 62 VWMA. I've found these two moving averages to be quite special in their ability to
//recognize a quick trend using volume data. The VWAP is used in the alert system as well, to give some perspective on which direction we are looking to take. We
//are also using ATR. We only take trades when the ATR is on the move, meaning we have a chance to catch a volatile move! Finally, we use RSI to help weed out bad
//trades. We only take 'longs' with bullish readings from RSI, and we only take 'shorts' with bearish readings from RSI. These alerts are fantastic for catching quick intraday
//trades in either direction. I recommend using a small 'take profit' target rather than using an exit indicator. These trades can move 20-30 pips and reverse just as quickly. Good luck!
//How To Use:
//When the alert system is added to the chart, you will notice up/down symbols appear at various locations. For bullish alerts, right click an 'Up' symbol and choose 'Add Alert on VWap & ATR..'
//There are two condition options. 'Long/short', and right below that 'Buy-Signal/Sell-Signal'. Choose 'long' and 'Buy-Signal'. At options, choose 'Once Per Bar Close'. Design your alert, and you're good to go.
//For bearish signals, find a 'down' signal on the chart. Right click and follow the same process, except choosing 'short/Sell-Signal' conditions.
Tips:
Use VWAP as a stop-loss. If a candle closes below/above the VWAP in the direction against you.. get out of the trade. The losses will be minimal and few compared to the wins. Use discretion and trade carefully. This works great with crypto. Invent your own exit. If you come up with a clever exit, please share!
You can contact me at my Discord!
discord.gg

DD ATR stop trailsATR based stop trails.
The top trail is basically lowest ATR since the last candle hit (with given length and multiplication) added to candle high.
The bottom trail is analogic.

RSI ATR ChannelDraws a channel based on ATR (Average True Range) and RSI. Detects band touches and colors the background appropriately.
