Lavender Multi-Signal Momentum StrategyOverview
The Lavender strategy is a sophisticated momentum-based trading system specifically optimized for Tesla (TSLA) on the 15-minute timeframe. It combines multiple technical signals to identify high-probability long entries during strong trending conditions.
Key Features
🎯 Multi-Signal Entry System
The strategy uses 4 distinct signal types that can be enabled/disabled individually:
Supertrend Pullback (Default: ON)
Identifies pullbacks in uptrends using Supertrend (ATR: 9, Factor: 0.5)
Enters when price retests EMA9-20 zone during bullish Supertrend
Donchian Breakout + Z-Score Momentum (Default: ON)
53-period Donchian channel breakouts
Combined with 35-period Z-Score momentum filter
Only triggers with positive momentum confirmation
Keltner Squeeze Expansion (Default: OFF)
Detects volatility squeeze conditions
Enters on breakout above Keltner Channel after compression
Opening Range Breakout (ORB) (Default: ON)
Tracks first hour range (9:30-10:30 AM)
Triggers on breakout above opening range high
🧭 Trend Regime Filter
EMA Trend Filter: 20 EMA > 100 EMA (Default: ON)
ADX Strength Filter: ADX > 22 with 15/13 smoothing (Default: ON)
Only trades when both trend conditions align
💵 Advanced Risk Management
Risk per Trade: 2.0% of capital (Default)
ATR-Based Stop Loss: 15-period ATR × 1.6 multiplier
Risk/Reward Ratio: 4:1 (Default)
Position Sizing: Automatic based on stop distance
Capital Options: Dynamic equity or fixed capital ($200,000 default)
⚙️ Execution Control
Candle Close Entries: Prevents intrabar noise (Default: ON)
Candle Close Exits: Stop loss and take profit only at bar close (Default: ON)
Trading Session: 9:00 AM - 4:00 PM (Default)
Trading Days: Monday-Saturday (Default: 123456)
Default Settings Summary
ParameterDefault ValuePurposeRisk per Trade2.0%Capital risk percentageATR Length15Stop loss calculationATR Multiplier1.6Stop distance factorRisk/Reward4.0Take profit multiplierEMA Fast20Short-term trendEMA Slow100Long-term trendADX Threshold22Minimum trend strengthMin Signals Required1Entry trigger thresholdInitial Capital$200,000Backtesting capital
How It Works
Trend Confirmation: Checks EMA alignment and ADX strength
Signal Generation: Scans for active momentum signals
Entry Execution: Enters when minimum signal threshold is met
Risk Management: Calculates position size based on ATR stop
Exit Management: Manages trades with 4:1 risk/reward ratio
Best Use Cases
Tesla (TSLA) on 15-minute charts
Trending market conditions
Intraday momentum trading
Markets with clear directional bias
Visual Indicators
Blue Line: 100-period EMA (trend filter)
Green/Red Line: Supertrend indicator
Teal Line: Donchian channel high
Purple Triangles: Keltner breakout signals
Orange Arrows: Opening range breakouts
Green Dots: Combined entry signals
Red/Green Lines: Active stop loss and take profit levels
Risk Disclaimer
This strategy is optimized for Tesla's specific price behavior on 15-minute timeframes. Past performance does not guarantee future results. Always test thoroughly and manage risk appropriately.
Created by kevloewe - Specialized for TSLA 15M momentum trading
Backtested

Autoback Grid Lab [trade_lexx]Autoback Grid Lab: Your personal laboratory for optimizing grid strategies.
Introduction
First of all, it is important to understand that Autoback Grid Lab is a powerful professional tool for backtesting and optimization, created specifically for traders using both grid strategies and regular take profit with stop loss.
The main purpose of this script is to save you weeks and months of manual testing and parameter selection. Instead of manually testing one combination of settings after another, Autoback Grid Lab automatically tests thousands of unique strategies on historical data, providing you with a comprehensive report on the most profitable and, more importantly, sustainable ones.
If you want to find mathematically sound, most effective settings for your grid strategy on a specific asset and timeframe, then this tool was created for you.
Key Features
My tool has functionality that transforms the process of finding the perfect strategy from a routine into an exciting exploration.
🧪 Mass testing of thousands of combinations
The script is able to systematically generate and run a huge number of unique combinations of parameters through the built-in simulator. You set the ranges, and the indicator does all the work, testing all possible options for the following grid settings:
* Number of safety orders (SO Count)
* Grid step (SO Step)
* Step Multiplier (SO Multiplier) for building nonlinear grids
* Martingale for controlling the volume of subsequent orders
* Take Profit (%)
* Stop Loss (%), with the possibility of calculating both from the entry point and from the dynamic breakeven line
* The volume of the base order (Volume BO) as a percentage of the deposit
🏆 Unique `FinalScore` rating system
Sorting strategies by net profit alone is a direct path to self—deception and choosing strategies that are "tailored" to history and will inevitably fail in real trading. To solve this problem, we have developed FinalScore, a comprehensive assessment of the sustainability and quality of the strategy.
How does it work?
FinalScore analyzes each combination not one by one, but by nine key performance metrics at once, including Net Profit, Drawdown, Profit Factor, WinRate, Sharpe coefficients, Sortino, Squid and Omega. Each of these indicators is normalized, that is, reduced to a single scale. Then, to test the strategy for strength, the system performs 30 iterations, each time assigning random weights to these 9 metrics. A strategy gets a high FinalScore only if it shows consistently high results under different evaluation criteria. This proves her reliability and reduces the likelihood that her success was an accident.
📈 Realistic backtesting engine
The test results are meaningless if they do not take into account the actual trading conditions. Our simulator simulates real trading as accurately as possible, taking into account:
* Leverage: Calculation of the required margin to open and hold positions.
* Commission: A percentage commission is charged each time an order is opened and closed.
* Slippage: The order execution price is adjusted by a set percentage to simulate real market conditions.
* Liquidation model: This is one of the most important functions. The script continuously monitors the equity of the account (capital + unrealized P&L). If equity falls below the level of the supporting margin (calculated from the current value of the position), the simulator forcibly closes the position, as it would happen on a real exchange. This eliminates unrealistic scenarios where the strategy survives after a huge drawdown.
🔌 Integration with external signals
The indicator operates in two modes:
1. `No Signal': Standard mode. The trading cycle starts immediately as soon as the previous one has been closed. Ideal for testing the "pure" mechanics of the grid.
2. `External Signal`: In this mode, a new trading cycle will start only when a signal is received from an external source. You can connect any other indicator (such as the RSI, MACD, or your own strategy) to the script and use it as a trigger to log in. This allows you to combine the power of a grid strategy with your own entry points.
📊 Interactive and informative results panel
Upon completion of the calculations, a detailed table with the TOP N best strategies appears on the screen, sorted according to your chosen criterion. For each strategy in the rating, you will see not only the key metrics (Profit, Drawdown, duration of transactions), but also all the parameters that led to this result. You can immediately take these settings and apply them in your trading.
Application Options: How To Solve Your Problems
Autoback Grid Lab is a flexible tool that can be adapted to solve various tasks, from complete grid optimization to fine—tuning existing strategies. Here are some key scenarios for its use:
1. Complete Optimization Of The Grid Strategy
This is the basic and most powerful mode of use. You can find the most efficient grid configuration for any asset from scratch.
* How to use: Set wide ranges for all key grid parameters ('SO Count`, SO Step, SO Multiplier, Martingale, TP, etc.).
* In the `No Signal` mode: You will find the most stable grid configuration that works as an independent, constantly active strategy, regardless of which-or entrance indicators.
* In the `External Signal` mode: You can connect your favorite indicator for input (for example, RSI, MACD or a complex author's script) and find the optimal grid parameters that best complement your input signals. This allows you to turn a simple signaling strategy into a full-fledged grid system.
2. Selecting the Optimal Take Profit and Stop Loss for Your Strategy
Do you already have an entry strategy, but you are not sure where it is best to put Take Profit and Stop Loss? Autoback Grid Lab can solve this problem as well.
* How to use:
1. Disable optimization of all grid parameters (uncheck SO Count, SO Step, Martingale, etc.). Set the Min value for SO Count to 0.
2. Set the ranges for iteration only for 'Take Profit` and `Stop Loss'.
3. Turn on the External Signal mode and connect your indicator with input signals.
* Result: The script will run your historical entry signals with hundreds of different TP and SL combinations and show you which stop order levels bring maximum profit with minimal risk specifically for your entry points.
3. Building a Secure Network with Risk Management
Many traders are afraid of grid strategies because of the risk of large drawdowns. With the help of the optimizer, you can purposefully find the parameters for such a grid, which includes mandatory risk management through Stop Loss.
* How to use: Enable and set the range for Stop Loss, along with other grid parameters. Don't forget to test both types of SL calculations (`From entry point` and `From breakeven line`) to determine which one works more efficiently.
* Result: You will find balanced strategies in which the grid parameters (number of orders, martingale) and the Stop Loss level are selected in such a way as to maximize profits without going beyond the acceptable risk level for you.
How To Use The Indicator (Step-By-Step Guide)
Working with the Autoback Grid Lab is a sequential process consisting of four main steps: from initial setup to analysis of the finished results. Follow this guide to get the most out of the tool.
Step 1: Initial Setup
1. Add the indicator to the chart of your chosen asset and timeframe.
2. Open the script settings. The first thing you should pay attention to is the ⚙️ Optimization Settings ⚙️ group.
3. Set the `Bars Count'. This parameter determines how much historical data will be used for testing.
* Important: The more bars you specify, the more statistically reliable the backtest results will be. We recommend using the maximum available value (25,000) to test strategies at different market phases.
* Consider: The indicator performs all calculations on the last historical bar. After applying the TradingView settings, it will take some time to load all the specified bars. The results table will appear only after the data is fully loaded. Don't worry if it doesn't appear instantly. And if an error occurs, simply switch the number of combinations to 990 and back to 1000 until the table appears.
Step 2: Optimization Configuration
At this stage, you define the "universe" of parameters that our algorithm will explore.
1. Set the search ranges (🛠 Optimization Parameters 🛠 group).
For each grid parameter that you want to optimize (for example, SO Count or `Take Profit'), you must specify three values:
* Min: The minimum value of the range.
* Max: The maximum value of the range.
* Step: The step with which the values from Min to Max will be traversed.
*Example:* If you set Min=5, Max=10, and Step=1 for SO Count, the script will test strategies with 5, 6, 7, 8, 9, and 10 safety orders.
* Tip for users: To get the first results quickly, start with a larger step (for example, TP from 0.5% to 2.5% in 0.5 increments instead of 0.1). After you identify the most promising areas, you can perform a deeper analysis by expanding the ranges around these values.
2. Set Up Money Management (Group `💰 Money Management Settings 💰`).
Fill in these fields with the values that best match your actual trading conditions. This is critically important for obtaining reliable results.
* Capital: Your initial deposit.
* Leverage: Leverage.
* Commission (%): Your trading commission as a percentage.
* Slippage (%): Expected slippage.
* Liquidation Level (%): The level of the supporting margin (MMR in %). For example, for Binance Futures, this value is usually between 0.4% and 2.5%, depending on the asset and position size. Specify this value for your exchange.
3. Select the Sorting Criterion and the Direction (Group `⚙️ Optimization Settings ⚙️').
* `Sort by': Specify the main criteria by which the best strategies will be selected and sorted. I strongly recommend using finalScore to find the most balanced and sustainable strategies.
* `Direction': Choose which trades to test: Long, Short or Both.
Step 3: Start Testing and Work with "Parts"
The total number of unique combinations generated based on your ranges can reach tens of millions. TradingView has technical limitations on the number of calculations that the script can perform at a time. To get around this, I implemented a "Parts" system.
1. What are `Part` and `Combinations in Part'?
* `Combinations in Part': This is the number of backtests that the script performs in one run (1000 by default).
* `Part`: This is the number of the "portion" of combinations that you want to test.
2. How does it work in practice?
* After you have everything set up, leave Part:1 and wait for the results table to appear. You will see the TOP N best strategies from the first thousand tested.
* Analyze them. Then, to check the next thousand combinations, just change the Part to 2 in the settings and click OK. The script will run a test for the next batch.
* Repeat this process by increasing the Part number (`3`, 4, 5...), until you reach the last available part.
* Where can I see the total number of parts? In the information row below the results table, you will find Total parts. This will help you figure out how many more tests are left to run.
Step 4: Analyze the Results in the Table
The results table is your main decision—making tool. It displays the best strategies found, sorted by the criteria you have chosen.
1. Study the performance metrics:
* Rating: Position in the rating.
* Profit %: Net profit as a percentage of the initial capital.
* Drawdown%: The maximum drawdown of the deposit for the entire test period.
* Max Length: The maximum duration of one transaction in days, hours and minutes.
* Trades: The total number of completed trades.
2. Examine the winning parameters:
* To the right of the performance metrics are columns showing the exact settings that led to this result ('SO Count`, SO Step, TP (%), etc.).
3. How to choose the best strategy?
* Don't chase after the maximum profit! The strategy with the highest profit often has the highest drawdown, which makes it extremely risky.
* Seek a balance. The ideal strategy is a compromise between high profitability, low drawdown (Drawdown) and the maximum length of trades acceptable to you (Max Length).
* finalScore was created to find this balance. Trust him — he often highlights not the most profitable, but the most stable and reliable options.
Detailed Description Of The Settings
This section serves as a complete reference for each parameter available in the script settings. The parameters are grouped in the same way as in the indicator interface for your convenience.
Group: ⚙️ Optimization Settings ⚙️
The main parameters governing the testing process are collected here.
* `Enable Optimizer': The main switch. Activates or deactivates all backtesting functionality.
* `Direction': Determines which way trades will be opened during the simulation.
* Long: Shopping only.
* Short: Sales only.
* Both: Testing in both directions. Important: This mode only works in conjunction with an External Signal, as the script needs an external signal to determine the direction for each specific transaction.
* `Signal Mode`: Controls the conditions for starting a new trading cycle (opening a base order).
* No Signal: A new cycle starts immediately after the previous one is completed. This mode is used to test "pure" grid mechanics without reference to market conditions.
* External Signal: A new cycle begins only when a signal is received from an external indicator connected via the Signal field.
* `Signal': A field for connecting an external signal source (works only in the `External Signal` mode). You can select any other indicator on the chart.
* For Long** trades, the signal is considered received if the value of the external indicator ** is greater than 0.
* For Short** trades, the signal is considered received if the value of the external indicator ** is less than 0.
* `Bars Count': Sets the depth of the history in the bars for the backtest. The maximum value (25000) provides the most reliable results.
* `Sort by`: A key criterion for selecting and ranking the best strategies in the final table.
* FinalScore: Recommended mode. A comprehensive assessment that takes into account 9 metrics to find the most balanced and sustainable strategies.
* Profit: Sort by net profit.
* Drawdown: Sort by minimum drawdown.
* Max Length: Sort by the minimum length of the longest transaction.
* `Combinations Count': Indicates how many of the best strategies (from 1 to 50) will be displayed in the results table.
* `Close last trade`: If this option is enabled, any active trade will be forcibly closed at the closing price of the last historical bar. For grid strategies, it is recommended to always enable this option in order to get the correct calculation of the final profit and eliminate grid strategies that have been stuck for a long time.
Group: 💰 Money Management Settings 💰
The parameters in this group determine the financial conditions of the simulation. Specify values that are as close as possible to your actual values in order to get reliable results.
* `Capital': The initial deposit amount for the simulation.
* `Leverage`: The leverage used to calculate the margin.
* `Slippage` (%): Simulates the difference between the expected and actual order execution price. The specified percentage will be applied to each transaction.
* `Commission` (%): The trading commission of your exchange as a percentage. It is charged at the execution of each order (both at opening and closing).
* `Liquidation Level' (%): Maintenance Margin Ratio. This is a critical parameter for a realistic test. Liquidation in the simulator occurs if the Equity of the account (Capital + Unrealized P&L) falls below the level of the supporting margin.
Group: 🛠 Optimization Parameters 🛠
This is the "heart" of the optimizer, where you set ranges for iterating through the grid parameters.
* `Part`: The portion number of the combinations to be tested. Start with 1, and then increment (`2`, 3, ...) sequentially to check all generated strategies.
* `Combinations in Part': The number of backtests performed at a time (in one "Part"). Increasing the value may speed up the process, but it may cause the script to error due to platform limitations. If an error occurs, it is recommended to switch to the step below and back.
Three fields are available for each of the following parameters (`SO Count`, SO Step, SO Multiplier, etc.):
* `Min`: Minimum value for testing.
* `Max': The maximum value for testing.
* `Step`: The step with which the values in the range from Min to Max will be iterated over.
There is also a checkbox for each parameter. If it is enabled, the parameter will be optimized in the specified range. If disabled, only one value specified in the Min field will be used for all tests.
* 'Stop Loss': In addition to the standard settings Min, Max, Step, it has an additional parameter:
* `Type`: Defines how the stop loss price is calculated.
* From entry point: The SL level is calculated once from the entry price (base order price).
* From breakeven line: The SL level is dynamically recalculated from the average position price after each new safety order is executed.
Group: ⚡️Filters⚡️
Filters allow you to filter out those results from the final table that do not meet your minimum requirements.
For each filter (`Max Profit`, Min Drawdown, `Min Trade Length`), you can:
1. Turn it on or off using the checkbox.
2. Select the comparison condition: Greater (More) or Less (Less).
3. Set a threshold value.
*Example:* If you set Less and 20 for the Min Drawdown filter, only those strategies with a maximum drawdown of less than 20% will be included in the final table.
Group: 🎨 Visual Settings 🎨
Here you can customize the appearance of the results table.
* `Position': Selects the position of the table on the screen (for example, Bottom Left — bottom left).
* `Font Size': The size of the text in the table.
* `Header Background / Data Background`: Background colors for the header and data cells.
* `Header Font Color / Data Font Color`: Text colors for the header and data cells.
Important Notes and Limitations
So that you can use the Autoback Grid Lab as efficiently and consciously as possible, please familiarize yourself with the following key features of its work.
1. It is a Tool for Analysis, not for Signals
It is extremely important to understand that this script does not generate trading signals in real time. Its sole purpose is to conduct in—depth research (**backtesting**) on historical data.
* The results you see in the table are a report on how a particular strategy would have worked in the past.
* The script does not provide alerts and does not draw entry/exit points on the chart for the current market situation.
* Your task is to take the best sets of parameters found during optimization and use them in your real trading, for example, when setting up a trading bot or in a manual trading system.
2. Features Of Calculations (This is not a "Repainting")
You will notice that the results table appears and is updated only once — when all historical bars on the chart are loaded. It does not change in real time with each tick of the price.
This is correct and intentional behavior.:
* To test thousands, and sometimes millions of combinations, the script needs to perform a huge amount of calculations. In the Pine Script™ environment, it is technically possible to do this only once, at the very last bar in history.
* The script does not show false historical signals, which then disappear or change. It provides a static report on the results of the simulation, which remains unchanged for a specific historical period.
3. Past Results do not Guarantee Future Results.
This is the golden rule of trading, and it fully applies to the results of backtesting. Successful strategy performance in the past is not a guarantee that it will be as profitable in the future. Market conditions, volatility and trends are constantly changing.
My tool, especially when sorting by finalScore, is aimed at finding statistically stable and reliable strategies to increase the likelihood of their success in the future. However, it is a tool for managing probabilities, not a crystal ball for predicting the future. Always use proper risk management.
4. Dependence on the Quality and Depth of the Story
The reliability of the results directly depends on the quantity and quality of the historical data on which the test was conducted.
* Always strive to use the maximum number of bars available (`Bars Count: 25,000`) so that your strategy is tested on different market cycles (rise, fall, flat).
* The results obtained on data for one month may differ dramatically from the results obtained on data for two years. The longer the testing period, the higher the confidence in the parameters found.
Conclusion
The Autoback Grid Lab is your personal research laboratory, designed to replace intuitive guesses and endless manual selection of settings with a systematic, data—driven approach. Experiment with different assets, timeframes, and settings ranges to find the unique combinations that best suit your trading style.

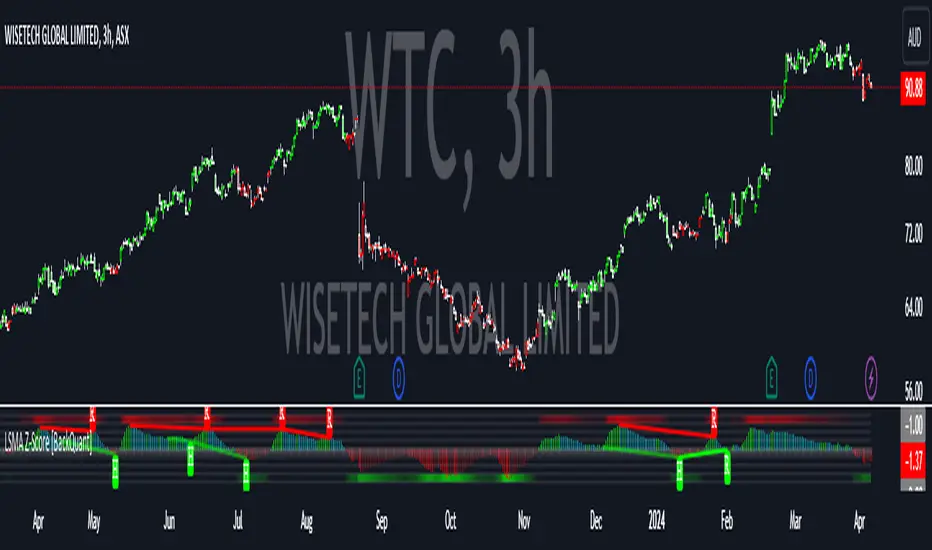
LSMA Z-Score [BackQuant]LSMA Z-Score
Main Features and Use in the Trading Strategy
- The indicator normalizes the LSMA into a detrended Z-Score, creating an oscillator with standard deviation levels to indicate trend strength.
- Adaptive coloring highlights the rate of change and potential reversals, with different colors for positive and negative changes above and below the midline.
- Extreme levels with adaptive coloring indicate the probability of a reversion, providing strategic entry or exit points.
- Alert conditions for crossing the midline or significant shifts in trend direction enhance its utility within a trading strategy.
1. What is an LSMA?
The Least Squares Moving Average (LSMA) is a technical indicator that smoothens price data to help identify trends. It uses the least squares regression method to fit a straight line through the selected price points over a specified period. This approach minimizes the sum of the squares of the distances between the line and the price points, providing a more statistically grounded moving average that can adapt more smoothly to price changes.
2. What is a Z-Score?
A Z-Score is a statistical measurement that describes a value's relationship to the mean of a group of values, measured in terms of standard deviations from the mean. If a Z-Score is 0, it indicates that the data point's score is identical to the mean score. A Z-Score helps in understanding if a data point is typical for a given data set or if it is atypical. In finance, a Z-Score is often used to measure how far a piece of data is from the average of a set, which can be helpful in identifying outliers or unusual data points.
3. Why Turning LSMA into a Z-Score is Innovative and Its Benefits
Converting LSMA into a Z-Score is innovative because it combines the trend identification capabilities of the LSMA with the statistical significance testing of Z-Scores. This transformation normalizes the LSMA, creating a detrended oscillator that oscillates around a mean (zero line), with standard deviation levels to show trend strength. This method offers several benefits:
Enhanced Trend Detection:
- By normalizing the LSMA, traders can more easily identify when the price is deviating significantly from its trend, which can signal potential trading opportunities.
Standardization:
- The Z-Score transformation allows for comparisons across different assets or time frames, as the score is standardized.
Objective Measurement of Trend Strength:
- The use of standard deviation levels provides an objective measure of trend strength and volatility.
4. How It Can Be Used in the Context of a Trading System
This indicator can serve as a versatile tool within a trading system for a range of things:
Trend Confirmation:
- A positive Z-Score can confirm an uptrend, while a negative Z-Score can confirm a downtrend, providing traders with signals to enter or exit trades.
Oversold/Overbought Conditions:
- Extreme Z-Score levels can indicate overbought or oversold conditions, suggesting potential reversals or pullbacks.
Volatility Assessment:
- The standard deviation levels can help traders assess market volatility, with wider bands indicating higher volatility.
5. How It Can Be Used for Trend Following
For trend following strategies, this indicator can be particularly useful:
Trend Strength Indicator:
- By monitoring the Z-Score's distance from zero, traders can gauge the strength of the current trend, with larger absolute values indicating stronger trends.
Directional Bias:
- Positive Z-Scores can be used to establish a bullish bias, while negative Z-Scores can establish a bearish bias, guiding trend following entries and exits.
Color-Coding for Trend Changes :
- The adaptive coloring of the indicator based on the rate of change and extreme levels provides visual cues for potential trend reversals or continuations.
Thus following all of the key points here are some sample backtests on the 1D Chart
Disclaimer: Backtests are based off past results, and are not indicative of the future.
This is using the Midline Crossover:
INDEX:BTCUSD
INDEX:ETHUSD
BINANCE:SOLUSD
DEMA Adjusted Average True Range [BackQuant]The use of the Double Exponential Moving Average (DEMA) within your Adjusted Average True Range (ATR) calculation serves as a cornerstone for enhancing the indicator's responsiveness to market changes. To delve deeper into why DEMA is employed specifically in the context of your ATR calculation, let's explore the inherent qualities of DEMA and its impact on the ATR's performance.
DEMA and Its Advantages
As previously mentioned, DEMA was designed to offer a more responsive alternative to the traditional Exponential Moving Average (EMA). By giving more weight to recent price data, DEMA reduces the lag typically associated with moving averages. This reduction in lag is especially beneficial for short-term traders looking to capitalize on trend reversals and other market movements as swiftly as possible.
The calculation of DEMA involves the following steps:
Calculate EMA1: This is the Exponential Moving Average of the price.
Calculate EMA2: This is the Exponential Moving Average of EMA1, thus it is a smoothing of a smoothing, leading to a greater lag.
Formulate DEMA: The formula
EMA1 = EMA of price
EMA2 = EMA of EMA1
DEMA = (2 x EMA1) - EMA2
effectively doubles the weighting of the most recent data points by subtracting the lagged, double-smoothed EMA2 from twice the single-smoothed EMA1.
This process enhances the moving average's sensitivity to recent price movements, allowing the DEMA to adhere more closely to the price bars than either EMA1 or EMA2 alone.
Integration with ATR
In the context of your ATR calculation, the integration of DEMA plays a crucial role in defining the indicator's core functionality. Here's a detailed explanation of how DEMA affects the ATR calculation:
Initial Determination of DEMA : By applying the DEMA formula to the chosen source data (which can be adjusted to use Heikin Ashi candle close prices for an even smoother analysis), you set a foundation for a more reactive trend-following mechanism within the ATR framework.
Application to ATR Bands : The calculated DEMA serves as the central line from which the ATR bands are derived. The ATR value, multiplied by a user-defined factor, is added to and subtracted from the DEMA to form the upper and lower bands, respectively. This dynamic adjustment not only reflects the volatility based on the ATR but does so in a way that is closely aligned with the most recent price action, thanks to the utilization of DEMA.
Enhanced Signal Quality : The responsiveness of DEMA ensures that the ATR bands adjust more promptly to changes in market conditions. This quality is vital for traders who rely on the ATR bands to identify potential entry and exit points, trend reversals, or to assess market volatility.
By employing DEMA as the core component in calculating the Adjusted Average True Range, your indicator leverages DEMA's reduced lag and increased weight on recent data to provide a more timely and accurate measure of market volatility. This innovative approach enhances the utility of the ATR by making it not only a tool for assessing volatility but also a more reactive indicator for trend analysis and trading signal generation.
The main concept of combining these is to reduce lag, get a more robust signal and still capture clear trends over medium time horizons.
For me, this is best used in confluence with other indicators, it can be made faster in order to get fasters response time, or slower. This is all depending on the needs of you as a trader.
User Inputs:
The script offers several user-configurable inputs, such as the period lengths for DEMA and ATR calculations, the multiplication factor for the ATR, and options to use Heikin Ashi candles or standard price data. Additionally, it allows for the toggling of visual features, like the plotting of the DEMA ATR and its moving average, and the application of color-coded trends on price bars.
Additional Features:
Moving Average Confluence: Traders can opt to display a moving average of the DEMA ATR, choosing from various types (e.g., SMA, EMA, HMA). This feature provides a layer of confluence, aiding in the identification of trend direction and strength.
Trend Identification :
The script employs logical conditions to ascertain the trend direction based on the movement of the DEMA ATR. It assigns colors to represent bullish or bearish trends, which are reflected in the plotted lines and the coloring of price bars.
Alerts :
Customizable alert conditions for trend reversals enhance the utility of the indicator for active trading, notifying users of significant changes in trend direction.
1D Backtests
We include these backtests as a general proxy for how they work.
Please do your own calibrating to suit it to your own needs and backtest.
Past results don't = future results but they can help you understand how it functions.
INDEX:BTCUSD
INDEX:ETHUSD
BINANCE:SOLUSD

RSI and MA with Trailing Stop Loss and Take Profit (by Coinrule)The relative strength index is a momentum indicator used in technical analysis. It measures the speed and magnitude of a coin's recent price changes to evaluate overvalued or undervalued conditions in the price of that coin. The RSI is displayed as an oscillator (a line graph essentially) on a scale of zero to 100. When the RSI reaches oversold levels, it can provide a signal to go long. When the RSI reaches overbought levels, it can mark a good exit point or alternatively, an entry for a short position. Traditionally, an RSI reading of 70 or above indicates an overbought situation. A reading of 30 or below indicates an oversold condition.
A moving average (MA) calculates the average of a selected range of prices, usually closing prices, by the number of periods in that range. Essentially it is used to help smooth out price data by creating a constantly updated average price.
The Strategy enters and closes trades when the following conditions are met:
Entry Conditions:
RSI is greater than 50
MA9 is greater than MA50
RSI increases by 5
Exit Conditions:
Price increases by 1% trailing
Price decreases by 2% trailing
This strategy is back-tested from 1 January 2022 to simulate how the strategy would work in a bear market. The strategy provides good returns.
The strategy assumes each order is using 30% of the available coins to make the results more realistic and to simulate you only ran this strategy on 30% of your holdings. A trading fee of 0.1% is also taken into account and is aligned to the base fee applied on Binance.

Session candles & reversals / quantifytools— Overview
Like traditional candles, session based candles are a visualization of open, high, low and close values, but based on session time periods instead of typical timeframes such as daily or weekly. Session candles are formed by fetching price at session start (open), highest price during session (high), lowest price during session (low) and price at session end (close). On top of candles, session based moving average is formed and session reversals detected. Session reversals are also backtested, using win rate and magnitude metrics to better understand what to expect from session reversals and which ones have historically performed the best.
By default, following session time periods are used:
Session #1: London (08:00 - 17:00, UTC)
Session #2: New York (13:00 - 22:00, UTC)
Session #3: Sydney (21:00 - 06:00, UTC)
Session #4: Tokyo (00:00 - 09:00, UTC)
Session time periods can be changed via input menu.
— Reversals
Session reversals are patterns that show a rapid change in direction during session. These formations are more familiarly known as wicks or engulfing candles. Following criteria must be met to qualify as a session reversal:
Wick up:
Lower high, lower low, close >= 65% of session range (0% being the very low, 100% being the very high) and open >= 40% of session range.
Wick down:
Higher high, higher low, close <= 35% of session range and open <= 60% of session range.
Engulfing up:
Higher high, lower low, close >= 65% of session range.
Engulfing down:
Higher high, lower low, close <= 35% of session range.
Session reversals are always based on prior corresponding session , e.g. to qualify as a NY session engulfing up, NY session must have a higher high and lower low relative to prior NY session , not just any session that has taken place in between. Session reversals should be viewed the same way wicks/engulfing formations are viewed on traditional timeframe based candles. Essentially, wick reversals (light green/red labels) tell you most of the motion during session was reversed. Engulfing reversals (dark green/red labels) on the other hand tell you all of the motion was reversed and new direction set.
— Backtesting
Session reversals are backtested using win rate and magnitude metrics. A session reversal is considered successful when next corresponding session closes higher/lower than session reversal close . Win rate is formed by dividing successful session reversal count with total reversal count, e.g. 5 successful reversals up / 10 reversals up total = 50% win rate. Win rate tells us what are the odds (historically) of session reversal producing a clean supporting move that was persistent enough to close that way too.
When a session reversal is successful, its magnitude is measured using percentage increase/decrease from session reversal close to next corresponding session high/low . If NY session closes higher than prior NY session that was a reversal up, the percentage increase from prior session close (reversal close) to current session high is measured. If NY session closes lower than prior NY session that was a reversal down, the percentage decrease from prior session close to current session low is measured.
Average magnitude is formed by dividing all percentage increases/decreases with total reversal count, e.g. 10 total reversals up with 1% increase each -> 10% net increase from all reversals -> 10% total increase / 10 total reversals up = 1% average magnitude. Magnitude metric supports win rate by indicating the depth of successful session reversal moves.
To better understand the backtesting calculations and more importantly to verify their validity, backtesting visuals for each session can be plotted on the chart:
All backtesting results are shown in the backtesting panel on top right corner, with highest win rates and magnitude metrics for both reversals up and down marked separately. Note that past performance is not a guarantee of future performance and session reversals as they are should not be viewed as a complete strategy for long/short plays. Always make sure reversal count is sufficient to draw reliable conclusions of performance.
— Session moving average
Users can form a session based moving average with their preferred smoothing method (SMA , EMA , HMA , WMA , RMA) and length, as well as choose which sessions to include in the moving average. For example, a moving average based on New York and Tokyo sessions can be formed, leaving London and Sydney completely out of the calculation.
— Visuals
By default, script hides your candles/bars, although in the case of candles borders will still be visible. Switching to bars/line will make your regular chart visuals 100% hidden. This setting can be turned off via input menu. As some sessions overlap, each session candle can be separately offsetted forward, clearing the overlaps. Users can also choose which session candles to show/hide.
Session periods can be highlighted on the chart as a background color, applicable to only session candles that are activated. By default, session reversals are referred to as L (London), N (New York), S (Sydney) and T (Tokyo) in both reversal labels and backtesting table. By toggling on "Numerize sessions", these will be replaced with 1, 2, 3 and 4. This will be helpful when using a custom session that isn't any of the above.
Visual settings example:
Session candles are plotted in two formats, using boxes and lines as well as plotcandle() function. Session candles constructed using boxes and lines will be clear and much easier on the eyes, but will apply only to first 500 bars due to Tradingview related limitations. Rest of the session candles go back indefinitely, but won't be as clean:
All colors can be customized via input menu.
— Timeframe & session time period considerations
As a rule of thumb, session candles should be used on timeframes at or below 1H, as higher timeframes might not match with session period start/end, leading to incorrect plots. Using 1 hour timeframe will bring optimal results as greatest amount historical data is available without sacrificing accuracy of OHLC values. If you are using a custom session that is not based on hourly period (e.g. 08:00 - 15:00 vs. 08.00 - 15.15) make sure you are using a timeframe that allows correct plots.
Session time periods applied by default are rough estimates and might be out of bounds on some charts, like NYSE listed equities. This is rarely a problem on assets that have extensive trading hours, like futures or cryptocurrency. If a session is out of bounds (asset isn't traded during the set session time period) the script won't plot given session candle and its backtesting metrics will be NA. This can be fixed by changing the session time periods to match with given asset trading hours, although you will have to consider whether or not this defeats the purpose of having candles based on sessions.
— Practical guide
Whether based on traditional timeframes or sessions, reversals should always be considered as only one piece of evidence of price turning. Never react to them without considering other factors that might support the thesis, such as levels and multi-timeframe analysis. In short, same basic charting principles apply with session candles that apply with normal candles. Use discretion.
Example #1 : Focusing efforts on session reversals at distinct support/resistance levels
A reversal against a level holds more value than a reversal by itself, as you know it's a placement where liquidity can be expected. A reversal serves as a confirming reaction for this expectation.
Example #2 : Focusing efforts on highest performing reversals and avoiding poorly performing ones
As you have data backed evidence of session reversal performance, it makes sense to focus your efforts on the ones that perform best. If some session reversal is clearly performing poorly, you would want to avoid it, since there's nothing backing up its validity.
Example #3 : Reversal clusters
Two is better than one, three is better than two and so on. If there are rapid changes in direction within multiple sessions consecutively, there's heavier evidence of a dynamic shift in price. In such case, it makes sense to hold more confidence in price halting/turning.

PIVOT STRATEGY [INDIAN MARKET TIMING]
A Back-tested Profitable Strategy for Free!!
A PIVOT INTRADAY STRATEGY for 5 minute Time-Frame , that also explains the time condition for Indian Markets
The Timing can be changed to fit other markets, scroll down to "TIME CONDITION" to know more.
The commission is also included in the strategy .
The basic idea is when ,
1) Price crosses above ema1 ,indicated by pivot highest line in green color .
2) Price crosses below ema1 ,indicated by pivot lowest line in red color .
3) Candle high crosses above pivot highest , is the Long condition .
4) Candle low crosses below pivot lowest , is the Short condition .
5) Maximum Risk per trade for the intraday trade can be changed .
6) Default_qty_size is set to 60 contracts , which can be changed under settings → properties → order size .
7) ATR is used for trailing after entry, as mentioned in the inputs below.
// ═════════════════════════//
// ————————> INPUTS <————————— //
// ═════════════════════════//
Leftbars —————> Length of pivot highs and lows
Rightbars —————> Length of pivot highs and lows
Price Cross Ema —————> Added condition
ATR LONG —————> ATR stoploss trail for Long positions
ATR SHORT —————> ATR stoploss trail for Short positions
RISK —————> Maximum Risk per trade for the day
The strategy was back-tested on RELIANCE ,the input values and the results are mentioned under "BACKTEST RESULTS" below .
// ═════════════════════════ //
// ————————> PROPERTIES<——————— //
// ═════════════════════════ //
Default_qty_size ————> 60 contracts , which can be changed under settings
↓
properties
↓
order size
// ═══════════════════════════════//
// ————————> TIME CONDITION <————————— //
// ═══════════════════════════════//
The time can be changed in the script , Add it → click on ' { } ' → Pine editor→ making it a copy [right top corner} → Edit the line 25 .
The Indian Markets open at 9:15am and closes at 3:30pm .
The 'time_cond' specifies the time at which Entries should happen .
"Close All" function closes all the trades at 3pm, at the open of the next candle.
To change the time to close all trades , Go to Pine Editor → Edit the line 103 .
All open trades get closed at 3pm , because some brokers don't allow you to place fresh intraday orders after 3pm .
NSE:RELIANCE
// ═══════════════════════════════════════════════ //
// ————————> BACKTEST RESULTS ( 128 CLOSED TRADES )<————————— //
// ═══════════════════════════════════════════════ //
INPUTS can be changed for better back-test results.
The strategy applied to NIFTY ( 5 min Time-Frame and contract size 60 ) gives us 60% profitability y , as shown below
It was tested for a period a 6 months with a Profit Factor of 1.45 ,net Profit of 21,500Rs profit .
Sharpe Ratio : 0.311
Sortino Ratio : 0.727
The graph has a Linear Curve with consistent profits .
The INPUTS are as follows,
1) Leftbars ————————> 3
2) Rightbars ————————> 5
3) Price Cross Ema ——————> 150
4) ATR LONG ————————> 2.7
5) ATR SHORT ———————> 2.9
6) RISK —————————> 2500
7) Default qty size ——————> 60
NSE:RELIANCE
Save it to favorites.
Apply it to your charts Now !!
↓
FOLLOW US FOR MORE !
Thank me later ;)

Consolidation Breakout [Indian Market Timing]OK let's get started ,
A Day Trading (Intraday) Consolidation Breakout Indication Strategy that explains time condition for Indian Markets .
The commission is also included in the strategy .
The basic idea is ,
1) Price crosses above upper band , indicated by a color change (green) is the Long condition .
2) Price crosses below lower band , indicated by a color change (red) is the Short condition .
3) ATR is used for trailing after entry
// ═══════════════════════════════//
// ————————> TIME CONDITION <————————— //
// ═══════════════════════════════//
The Indian Markets open at 9:15am and closes at 3:30pm.
The time_condition specifies the time at which Entries should happen .
"Close All" function closes all the trades at 2:57pm.
All open trades get closed at 2:57pm , because some brokers dont allow you to place fresh intraday orders after 3pm.
NSE:NIFTY1!
// ═══════════════════════════════════════════════ //
// ————————> BACKTEST RESULTS ( 114 CLOSED TRADES )<————————— //
// ═══════════════════════════════════════════════ //
LENGTH , MULT (factor) and ATR can be changed for better backtest results.
The strategy applied to NIFTY (3 min Time-Frame and contract size 5) gives us 60% profitability , as shown below
It was tested for a period a 8 months with a Profit Factor of 2.2 , avg Trade of 6000Rs profit and Sharpe Ratio : 0.67
The graph has a Linear Curve with consistent profits.
NSE:NIFTY1!
Save it favorites.
Apply it to your charts Now !!
Thank me later ;)

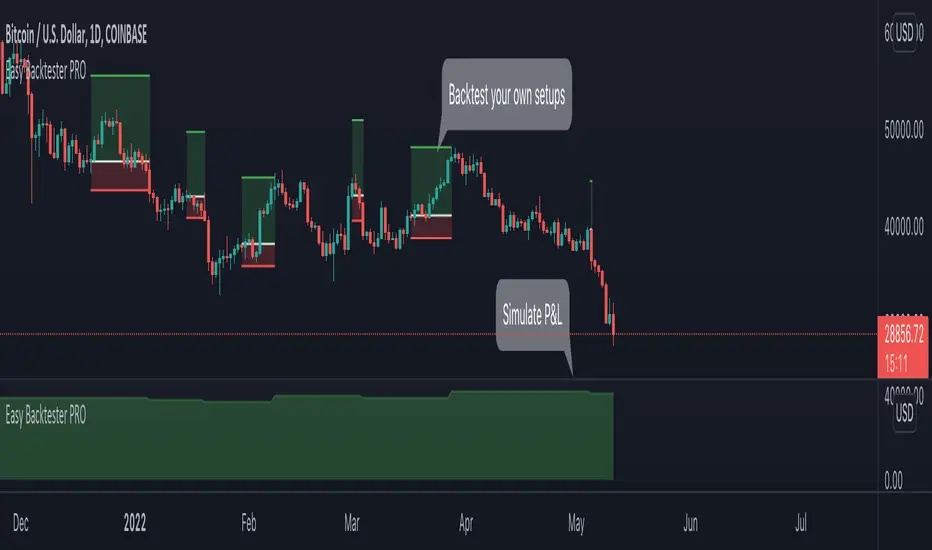
Easy Backtester PROWHAT IS EasyBacktester ?
EasyBacktester is a tool that helps you backtest trading strategies built by yourself with an included strategy builder and a multitude of options.
From within the parameters of the tool, you can specifically pick your entry settings across 12 most common indicators, such as "RSI", "MACD", "Moving Averages" etc... Then you can immediately visualise your setup's Stop-loss & Take Profit, your expected Profits & Loss and a lot of other statistics for your entry strategy. Once you are satisfied with your entry strategy, you are given a set of tools to optimize your setup using stop-loss rules, take profits rules, partial profits, trailing-stops, entry timing...
WHY IS THIS TOOL DIFFERENT ?
EasyBacktester is a backtesting engine with no coding skills required. TradingView allows for "Strategy Scripting" using PineScript, which is not an option for non-coder audience. EasyBacktester fills this gap and allow non-coders to get an idea of how their trading strategies may perform using mouse clicks only.
Some similar attempts have been made on TradingView, allowing some limited options, but none have the same capabilities EasyBacktester offers, for instance, as of April 2022 these features have not been seen in any other TradingView tools:
- partial take profits
- leverage simulation
- a multitude of trailing stop-loss possibilities including trail triggers and trail parameters
- visualisation of entries including stop-loss, take profits, partial take profits, and trailing stops. One can now visualize such complex setups.
- visualisation of Profits & Loss
- time in trade
- wait strategy after a signal: for example, when RSI is oversold, "WAIT until price retraces 100% of the original signal" amongst other possibilities
QUICK START GUIDE:
STEP 1: DEFINE YOUR SIGNAL STRATEGY
From the settings of the tool, find the "SIGNALS STRATEGY" section.
Select a type of entry you wish to simulate, for example "LONGs", and activate the checkbox right before "Simulate".
Right below, you will find 4 signal builder for you to play with and pick your strategy accordingly.
For example, to simulate a signal when RSI is oversold, follow these steps:
- On the 1st multiple choice box, select "RSI"
- On the 2nd multiple choice box, select "is below..."
- On the 3rd multiple choice box, select "OverSold level"
Don't forget to activate this rule by checking the checkbox in front of it.
After this first step, one should immediately see the chart affected with some plots. The dots represents the signal entry defined by the rule we just created, and the red/green boxes visually represent trades that could have been taken with this signal which, in this example, occurs "when RSI is below oversold level". Note that all specific parameters for RSI including its specific "oversold level" is customisable at the end of the tools settings along with all other indicators settings.
STEP 2: STATISTICS
By default, the "APPEARANCE" section only plots potential entry signals (materialized by dots) and actual entry boxes (materialized by red/green boxes).
But the user can easily add other precious statistics to the chart, and obviously the most important one for backtesting: Profits & Loss (P&L).
In the "STATISTICS" section please check the "P&L" box to see appear a chart of the simulated P&L for our example. You should immediately see a new graph below the chart representing the evolution of the P&L after each entry.
Other statistics are available to the user, including: Equity, Number of Trades, Time in Position, Number of trades Won, Number of trades Lost, Number of trades Stopped.
Play around with those to see them plotted on your chart.
STEP 3: OPTIMIZE YOUR ENTRY
Under the "ENTRY STRATEGY" section, one can pick how to enter AFTER the signal, which provides the user with an extensive flexibility to pick its timing.
Here there are a various set of choices offered, ranging from the default "Market Order at Next Candle Open", to "Limit Order: at signal's candle open" or even "Stop-Buy: at break of last candle high". As its name suggests, this option allows you to actually wait before randomly enter in trade.
It is important to also note that the user can totally prevent entry if the conditions are not filled after a customizable number of candles represented in "Max bars to wait for entry" (default being 1, meaning the engine will wait the condition to be filled during only 1 candle)
STEP 4: MANAGE YOUR RISK
Under the "RISK MANAGEMENT" section, the user is given a series of options to set the amount (s)he would like to risk.
This is extremely important to set, and is the result of a combination of customizable options including:
- the Initial Capital of the account
- the amount to risk per trade, and HOW to risk it: some fixed % the initial equity or adjust the stop-loss to the desired risk ?
- use of leverage or not
- initial stop-loss, as well as minimum and maximum
- trailing stop-loss: what should trigger the trailing ? and by how much should the engine trail ?
STEP 5: HAVE AN EXIT PLAN
Under the "EXIT STRATEGY", the user can define how to exit the trade.
For instance, here again a lot of options are given:
- Take Profit: exit at some level of profits defined by a multiple of the stop-loss, or a multiple of the ATR, or some % or points
- Partial Profit taking before exit
- Panic close position after some time spent on the trade
STEP 6: FURTHER OPTIMIZATIONS
Under the sections "Commissions" & "Calendar & Sessions", one can simulate real trading conditions by including commissions fees as well as filtering actual dates and trading sessions. These sections are straightforward for any user to use.
SETP 7: INDICATORS SETTINGS
Since EasyBacktester uses a predefined set of indicators to get started, those indicators are also customizable in the last section of the settings. Here, one can easily customize RSI periodicity, MACD lengths, Moving averages types & lengths, ATR, etc...
STEP 8: GOING FURTHER
This is only a start to give users an overview of how various options affect their trading performance. But of course, each trader has its special recipe and specific detailed setup that is not possible to embed in a single tool. For advanced simulation, EasyBacktester provides plug & play connectors for advanced users. Namely, there are 3 connectors:
- signal connector
- trail trigger connector
- exit connector
Each of these connectors are an opportunity to customize the engine signals, trail trigger and exit choices with the user's own options. This case does require a little bit of coding, but it can easily be implemented by copy-pasting existing resources or with a slight help of a professional. In fact, the only conditions to build a proper connector is to export a plot with the numbers 1 (for signals), 2 (for trigger trails) and 3 (for exits). Here is an example of custom SIGNAL connector compatible with EasyBacktester, to produce a signal when last RSI was below 30 and current RSI reads above 30:
============================================================
//@version=5
indicator("My custom RSI signal")
// when previous RSI 14 was below 30 and current RSI 14 is above 30, set "custom_signal" to 1, otherwise set "custom_signal" to 0
custom_signal = ta.rsi(close, 14) < 30 and ta.rsi(close, 14) > 30 ? 1 : 0
// Export a plot of "custom_signal", but do not display it
plot(custom_signal, title="my signal", display=display.none)
============================================================
Once this indicator has been built, the user only needs to connect it with EasyBacktester as follow:
1. Open a desired chart, and add both EasyBacktester indicator as well as the custom "My custom signal" we just created above.
2. Open EasyBacktester's settings, and in the first option, there is "Connect signals source" which by default is set to "close". In the multiple choices, find your custom signal which should be named something like "My custom RSI signal: my signal", generally speaking the name is built like this " : ".
3. Now the custom code is connected to EasyBacktester, but we need to indicate the engine we actually want to use it as custom signal.
4. Under the "SIGNALS STRATEGY" section, where we generally build signals rules, there is special rule for this specific connection named "Use external source as entry signal". Just check the checkbox to activate it and see how the chart took our custom signal into consideration.
That's it for the overview of EasyBacktester. Thank you for reading and happy trading :)
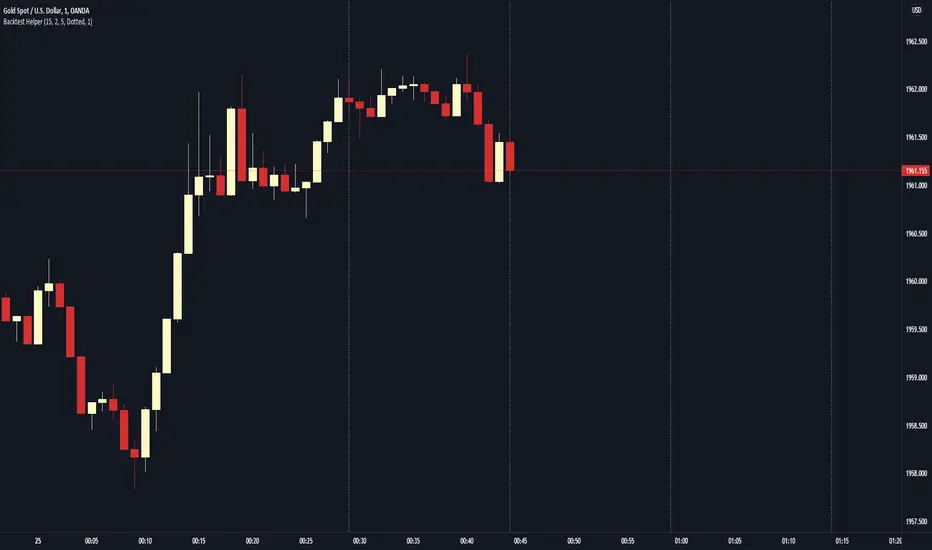
Backtest HelperAre you tired of being able to see the future while you're backtesting? Have you ever clicked to a higher timeframe in bar replay, only to realize you've just seen everything that's going to happen before you've had a chance to test it? If you've had this problem, Backtest Helper is here for YOU.
All you have to do is set a start date and time, then set your desired timeframe in minutes, then you're off to the races.
For example, if you're a scalper that uses the 15 minute as their higher timeframe, set your start time at the 14th minute of the session you're testing and set your line spacing at 15 minutes. This will mark off every 14th minute on the charts. Now you know the exact moment you can go up to the 15 minute timeframe!
On our 1 minute timeframe, this is how we'd look with the above settings. The Backtest Helper has marked off the 14th, 29th, 44th and 59th minute.
When we go up to our 15 minute, there's no issues. We're seeing the candle we want to see and not the next 15 minute candle.
You can use this for any timeframe. Just make sure you set your start time to at least 1 minute before the close of the candle and your line spacing to the higher timeframe (in minutes) you want to target.

TradersAI_UTBotCREDITS to @HPotter for the orginal code.
CREDITS to @Yo_adriiiiaan for recently publishing the UT Bot study based on the original code -
I just added some simple code to turn it into a strategy. Now, anyone can simply add the strategy to their chart to see the backtesting results!
While @Yo_adriiiiaan mentions it works best on a 4-hour timeframe or above, I am happy to share that this seems to be working on a 15-minute chart on e-mini S&P 500 Index (using the KeyValue setting at 10)! You can play around with the different settings, and may be you might discover even better settings.
Hope this helps. Btw, if any of you play with different settings and discover great settings for a specific instrument, please share them with the community here - it will be rewarded back multiple times!
