PaisaPani - BankNifty Demo PerformanceThis indicator displays a DEMO performance snapshot
to show how the PaisaPani approach behaves on BankNifty.
It is a trading system.
• Separate indicator designed specifically for BankNifty
• Intended for the mentioned timeframe only
• Focused on execution clarity, not predictions
🔒 Full access is limited.
Message “ACCESS” on TradingView if you want details.
⚠ Disclaimer:
For educational and demonstration purposes only.
Trading involves risk.
No profit guarantees are implied.
Bankniftytradesetup

SNP420_Five_to_Five_INDIFor consistent 9-5 traders.
Use for your traidingroutine.
Change colours and time for your strategy.
Peace and love! SNP420

3/4-Bar GRG / RGR Pattern (Conditional 4th Candle)This indicator can be used to identify the Green-Red-Green or Red-Green-Red pattern.
It is a price action indicator where a price action which identifies the defeat of buyers and sellers.
If the buyers comprehensively defeat the sellers then the price moves up and if the sellers defeat the buyers then the price moves down.
In my trading experience this is what defines the price movement.
It is a 3 or 4 candle pattern, beyond that i.e, 5 or more candles could mean a very sideways market and unnecessary signal generation.
How does it work?
Upside/Green signal
Say candle 1 is Green, which means buyers stepped in, then candle 2 is Red or a Doji, that means sellers brought the price down. Then if candle 3 is forming to be Green and breaks the closing of the 1st candle and opening of the 2nd candle, then a green arrow will appear and that is the place where you want to take your trade.
Here the buyers defeated the sellers.
Sometimes candle 3 falls short but candle 4 breaks candle 1's closing and candle 2's opening price. We can enter on candle 4.
Important - We need to enter the trade as soon as the price moves above the candle 1 and 2's body and should not wait for the 3rd or 4th candle to close. Ignore wicks.
I have restricted it to 4 candles and that is all that is needed. More than that is a longer sideways market.
I call it the +-+ or GRG pattern.
Stop loss can be candle 2's mid for safe traders (that includes me) or candle 2's body low for risky traders.
Back testing suggests that body low will be useless and result in more points in loss because for the bigger move this point will not be touched, so why not get out faster.
Downside/Red signal
Say candle 1 is Red, which means sellers stepped in, then candle 2 is Green or a Doji, that means buyers took the price up. Then if candle 3 is forming to be Red and breaks the closing of the 1st candle and opening of the 2nd candle then a Red arrow will appear and that is the place where you want to take your trade.
Sometimes candle 3 falls short but candle 4 breaks candle 1's closing and candle 2's opening price. We can enter on candle 4.
We need to enter the trade as soon as the price moves below the candle 1 and 2's body and should not wait for the 3rd or 4th candle to close.
I have restricted it to 4 candles and that is all that is needed. More than that is a longer sideways market.
I call it the -+- or RGR pattern.
Stop loss can be candle 2's mid for safe traders ( that includes me) or candle 2's body high for risky traders.
Back testing suggests that body high will be useless and result in more points in loss because for the bigger move this point will not be touched, so why not get out faster.
Important Settings
You can enable or disable the 4th candle signal to avoid the noise, but at times I have noticed that the 4th candle gives a very strong signal or I can say that the strong signal falls on the 4th candle. This is mostly a coincidence.
You can also configure how many previous bars should the signal be generated for. 10 to 30 is good enough. To backtest increase it to 2000 or 5000 for example.
Rest are self explanatory.
Pointers
If after taking the trade, the next candle moves in your direction and closes strong bullish or bearish, then move SL to break even and after that you can trail it.
If a upside trade hits SL and immediately a down side trade signal is generated on the next candle then take it. Vice versa is true.
Trades need to be taken on previous 2 candle's body high or low combined and not the wicks.
The most losses a trader takes is on a sideways day and because in our strategy the stop loss is so small that even on a sideways day we'll get out with a little profit or worst break even.
Hold targets for longer targets and don't panic.
If last 3-4 days have been sideways then there is a good probability that day will be trending so we can hold our trade for longer targets. Target to hold the trade for whole day and not exit till the day closes.
In general avoid trading in the middle of the day for index and stocks. Divide the day into 3 parts and avoid the middle.
Use Support/Resistance, 10, 20, 50, 200 EMA/SMA, Gaps, Whole/Round numbers(very imp) for identifying targets.
Trail your SL.
For indexes I would use 5 min and 15 min timeframe.
For commodities and crypto we can use higher timeframe as well. Look for signals during volatile time durations and avoid trading the whole day. Signal usually gives good targets on those times.
If a GRG or RGR pattern appears on a daily timeframe then this is our time to go big.
Minimum Risk to Reward should be 1:2 and for longer targets can be 1:4 to 1:10.
Trade with small lot size. Money management will happen automatically.
With small lot size and correct Risk-Re ward we can be very profitable. Don't trade with big lot size.
Stay in the market for longer and collect points not money.
Very imp - Watch market and learn to generate a market view.
Very imp - Only 4 candles are needed in trading - strong bullish, strong bearish, hammer, inverse hammer and doji.
Go big on bearish days for option traders. Puts are better bought and Calls are better sold.
Cluster of green signals can lead to bigger move on the upside and vice versa for red signals.
Most of this is what I learned from successful traders (from the top 2%) only the indicator is mine.

F&O Time Zones – Final Fixed📌 This indicator highlights high-probability intraday time zones used in Indian F&O (Futures & Options) strategies. Ideal for scalping, breakout setups, and trap avoidance.
🕒 Covered Time Zones:
• 9:15 – 9:21 AM → Flash Trades (first 1-minute volatility)
• 9:21 – 9:30 AM → Smart Money Trap (VWAP fakeouts)
• 9:30 – 9:50 AM → Fake Breakout Zone
• 9:50 – 10:15 AM → Institutional Entry Timing
• 10:15 – 10:45 AM → VWAP Range Scalps
• 10:45 – 11:15 AM → Second Trap Zone
• 11:15 – 1:00 PM → Trend Continuation Window
• 1:00 – 1:45 PM → Volatility Compression
• 1:45 – 2:15 PM → Institutional Exit Phase 1
• 2:15 – 2:45 PM → Trend Acceleration / Reversals
• 2:45 – 3:15 PM → Expiry Scalping Zone
• 3:15 – 3:30 PM → Dead Zone (square-off time)
🔧 Features:
✓ Clean vertical lines per zone
✓ Optional label positions (top or bottom)
✓ Adjustable line style, width, and color
🧠 Best used on: NIFTY, BANKNIFTY, FINNIFTY (5-min or lower)
---
🔒 **Disclaimer**:
This script is for **educational purposes only**. It is not financial advice. Trading involves risk. Please consult a professional or do your own research before taking any positions.
—
👤 Script by: **JoanJagan**
🛠️ Built in Pine Script v5

5EMA_BB_ScalpingWhat?
In this forum we have earlier published a public scanner called 5EMA BollingerBand Nifty Stock Scanner , which is getting appreciated by the community. That works on top-40 stocks of NSE as a scanner.
Whereas this time, we have come up with the similar concept as a stand-alone indicator which can be applied for any chart, for any timeframe to reap the benifit of reversal trading.
How it works?
This is essentially a reversal/divergence trading strategy, based on a widely used strategy of Power-of-Stocks 5EMA.
To know the divergence from 5-EMA we just check if the high of the candle (on closing) is below the 5-EMA. Then we check if the closing is inside the Bollinger Band (BB). That's a Buy signal. SL: low of the candle, T: middle and higher BB.
Just opposite for selling. 5-EMA low should be above 5-EMA and closing should be inside BB (lesser than BB higher level). That's a Sell signal. SL: high of the candle, T: middle and lower BB.
Along with we compare the current bar's volume with the last-20 bar VWMA (volume weighted moving average) to determine if the volume is high or low.
Present bar's volume is compared with the previous bar's volume to know if it's rising or falling.
VWAP is also determined using `ta.vwap` built-in support of TradingView.
The Bolling Band width is also notified, along with whether it is rising or falling (comparing with previous candle).
What's special?
We love this reversal trading, as it offers many benifits over trend following strategies:
Risk to Reward (RR) is superior.
It _Does Hit_ stop losses, but the stop losses are tiny.
Means, althrough the Profit Factor looks Nahh , however due to superior RR, end of day it ended up in green.
When the day is sideways, it's difficult to trade in trending strategies. This sort of volatility, reversal strategies works better.
It's always tempting to go agaist the wind. Whole world is in Put/PE and you went opposite and enter a Call/CE. And turns out profitable! That's an amazing feeling, as a trader :)
How to trade using this?
* Put any chart
* Apply this screener from Indicators (shortcut to launch indicators is just type / in your keyboard).
* It will show you the Green up arrow when buy alert comes or red down arrow when sell comes. * Also on the top right it will show the latest signal with entry, SL and target.
Disclaimer
* This piece of software does not come up with any warrantee or any rights of not changing it over the future course of time.
* We are not responsible for any trading/investment decision you are taking out of the outcome of this indicator.

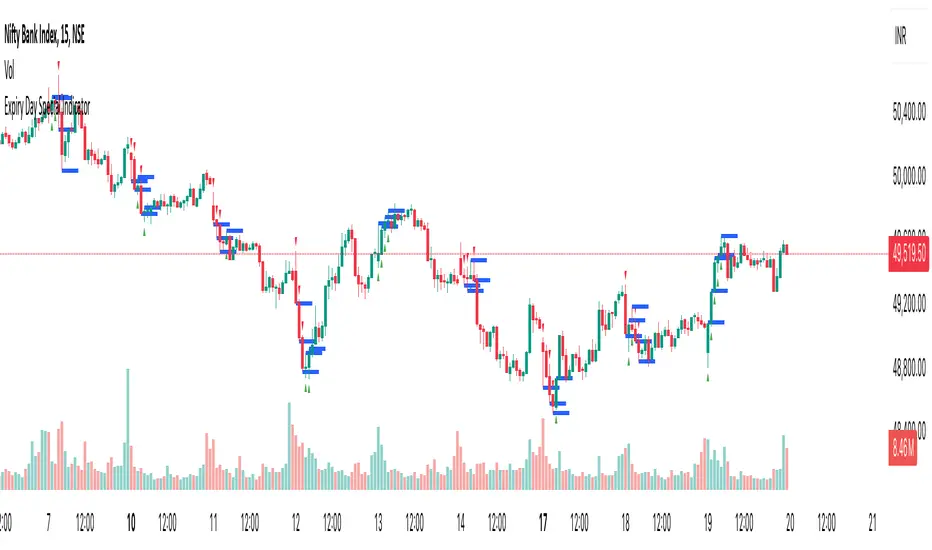
Expiry Day Special IndicatorExpiry Day Special Indicator
The Expiry Day Special Indicator is designed to detect catalytic price action patterns that commonly occur between 9:15 AM to 10:15 AM (IST) in the Nifty & Bank Nifty markets but not limited to these specific markets. While these patterns are particularly useful on expiry days, they are not limited to expiry trading alone. They can also be applied on other trading days when similar conditions arise, making them versatile for intraday traders.
How It Works
This indicator scans for bullish and bearish price action patterns within the first trading hour and plots potential buy and sell signals based on key market structures.
• Bearish Patterns: Identifies strong rejection zones and weakness in price action to signal potential short trades.
• Bullish Patterns: Recognizes reversal formations that indicate potential long trade opportunities.
• Time Filter: The setup is valid only between 9:15 AM - 10:15 AM (IST) to focus on high-impact market moves.
Why This Indicator?
1. Specialized for Nifty & Bank Nifty – Designed specifically for Indian markets.
2. Early Trend Identification – Helps traders capture moves early in the session.
3. Works Beyond Expiry Days – Although optimized for expiry trading, it can also detect similar patterns on regular days.
📌 Note: This indicator does not provide trading advice; always use proper risk management.
Strategy:Reversal-CatcherWhat
This is a plain and vanilla reversal based strategy for intraday (15m) timeframe on Futures prices of the assets.
Now what all it comprises of?
It finds out the dynamic support & resistance from Bollinger Band (20 period, 1.5 std dev).
It finds out the potential divergence of price deviation from 5 period exponential moving average (EMA).
If the previous candle (N-1) shows a divergence it confirms the reversal by checking the present candle (N) to be closed inside the Bollinger Band.
It confirms the momentum by checking RSI shows a crossover/crossunder to oversold (30) / overbought (70) region.
It also confirms whether the trend is up (then only reversal trade to short) or down (then only reversal trade to long). The trend is checked with EMA-21 and EMA-50.
Re-affirmation Condition : It re-affirms the position of two successive candles called as `hhLLong` and `hhLLShort` in the script.
Why
In Indian context, retail participants are pre-dominantly (yes- 80% of Indian daily volume) Options buyers mainly in weekly indices (Nifty, BankNifty, FinNifty, CNXMidcap, Sensex, Bankx .. well everyday is expiry now in India, except -- Thank God -- Saturday & Sunday).
And in Index Options the momentum plays a big role.
If one can catch a good reversal point the potential of high Risk-to-Reward trade (hence earn handsomely) is very likely (please note: there is no holy grail in trading. Nothing works 100%).
So this is the attempt to catch a reversal.
Re-affirmation of Reversal
hhLLong : It's a reversal point after an uptrend. It checks the relative positioning of current candle compared to that of previous candle. [The details are in the script. Check for variable hhLLong in script.
hhLLShort : It's a reversal point after a downtrend. It checks the relative positioning of current candle compared to that of previous candle. [The details are in the script. Check for variable hhLLShort in script.
Unique-ness
What's unique in it? Why we decided to publicly share this:
Already given the context of The Great Indian Options Buyers community. It should be helpful to them, we believe.
It takes Very Less Number of Trades with High Accuracy . Please check the result in NSE:NIFTY1! in 15m timeframe. 71% accuracy with roughly a trade in a month.
There is no point giving brokers' the brokerages taking 10 trades a day and ending not-so-good EoD. Better lets take less trades with better result possibility. .
Mention
There are many people uses this variation of Bolling Band, 5EMA
Many people use RSI, trends and relative positioning of candles.
--> We are grateful to all of them. It's really difficult to mention everyone's name. But all people somehow influence the thought process. Thanks for all of them.
Statutory Disclaimer
There is no silver bullet / holy grail in trading. Nothing works 100% time. One has to be careful about the loss (s)he can bear in case of the trade goes against.
We, as the author of this script, is not responsible for any trading or position decision one is taken based on the outcome of this.
It is our sole discretion to change, add, delete the portion or withdraw the whole script without any prior notice or intimation.
In Indian Context : We are not SEBI registered, will never be SEBI registered.

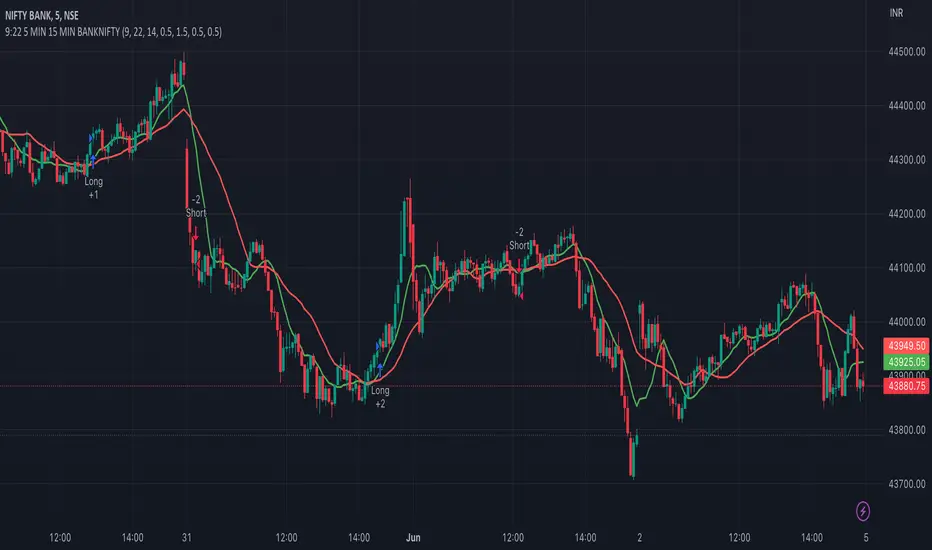
9:22 5 MIN 15 MIN BANKNIFTY9:22 5 MIN 15 MIN BANKNIFTY Strategy with Additional Filters
The 9:22 5 MIN 15 MIN BANKNIFTY Strategy with Additional Filters is a trend-following strategy designed for trading the BANKNIFTY instrument on a 5-minute chart. It aims to capture potential price movements by generating buy and sell signals based on moving average crossovers, breakout confirmations, and additional filters.
Key Features:
Fast MA Length: 9
Slow MA Length: 22
ATR Length: 14
ATR Filter: 0.5
Trailing Stop Percentage: 1.5%
Pullback Threshold: 0.5
Minimum Candle Body Percentage: 0.5
Use Breakout Confirmation: Enabled
Additional Filters:
Volume Threshold: Set a minimum volume requirement for trades.
Trend Filter: Optionally enable a trend filter based on a higher timeframe moving average.
Momentum Filter: Optionally enable a momentum filter using the RSI indicator.
Support/Resistance Filter: Optionally enable a filter based on predefined support and resistance levels.
Buy and Sell Signals:
Buy Signal: A buy signal is generated when the fast moving average crosses above the slow moving average, with additional confirmation from breakout and volume criteria, along with optional trend, momentum, and support/resistance filters.
Sell Signal: A sell signal is generated when the fast moving average crosses below the slow moving average, with similar confirmation and filtering criteria as the buy signal.
Exit Strategy:
The strategy employs a trailing stop-loss mechanism based on a percentage of the average entry price. The stop-loss is dynamically adjusted to protect profits while allowing for potential upside.
Please note that this strategy should be thoroughly backtested and evaluated in different market conditions before applying it to live trading. It is also recommended to adjust the parameters and filters according to individual preferences and risk tolerance.
Feel free to customise and adapt the description as needed to suit your preferences and the specific details of your strategy.
BankNifty 5min Supertrend Based StrategyBankNifty 5min Supertrend Based Strategy, Intraday.
Work Best at 5mint chart on BankNifty.
The strategy is designed to trade using the Supertrend indicator with session-based rules, and risk management. It allows for customization through input variables and aims to provide a clear visual representation of the Supertrend by changing the color .
The script also includes input variables for the trading session and date range, which allows the trader to specify the time period in which they want the strategy to run. The session variable specifies the start and end times of the trading session, which in this case is set to the Indian trading session from 9:15 am to 3:10 pm.
The strategy starts by defining input variables such as the session time, start and end date for the backtesting, the length of the ATR, and the Supertrend factor. It also includes options for delay at session start and stop loss points and trail percentage .
The code then checks if the current time is within the specified session and date range . If it is, the Supertrend and its direction are calculated using the defined input variables. The strategy then waits for N numbers of candles (defined by the User) to form at the start of every session i.e. 09:15 AM before entering a trade.
The entry and exit conditions for long and short trades are defined based on the change in the Supertrend direction and the number of candles formed at the session start i.e. 09:15 AM . After that, it takes entry and exit for long and short trades on the change in the Supertrend direction . Stop-loss and trailing stop-loss are also defined based on the input variables.
Stop-loss (Defined by the user) is fixed points either below or above the Entry Price for Long and Short entries.
The Supertrend plot is displayed with changing colors depending on the direction. Finally, the strategy closes all trades at the end of the session if there are any open trades.
Overall, this strategy aims to trade with the Supertrend indicator using session-based rules and risk management.
However, as with any trading strategy, it is important to thoroughly test it before using it in live trading .

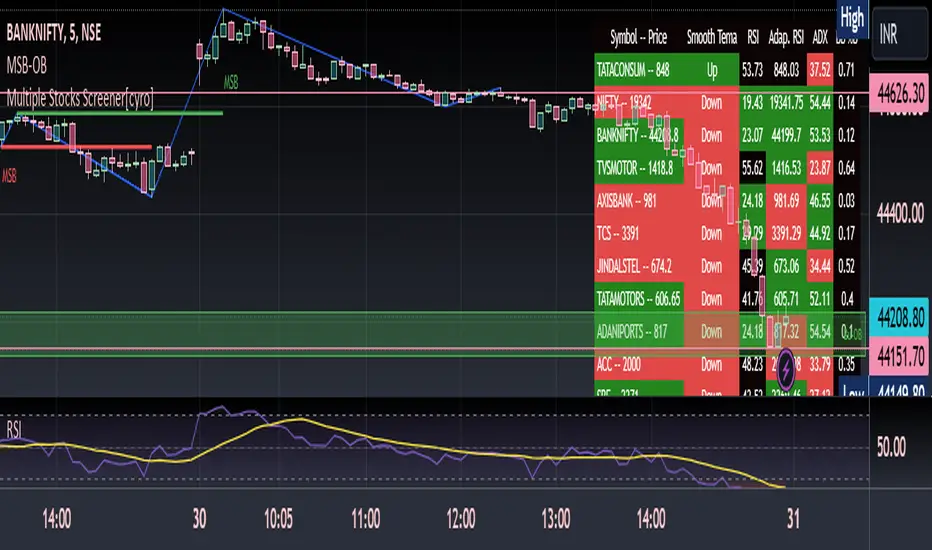
Multiple Indicators ScreenerThis is a stock screener that incorporates open source code by QuantNomad, with the addition of slow and fast EMA pullback and crossover functions. It is designed for intraday scalping and quick trades, using 1, 3, and 5 minute candles. The RSI, Supertrend, and ADX indicators help to confirm trade setups, and the use of discount, premium, and equilibrium zones can improve results. With the ability to screen 40 stocks, the screener ensures that no quick action is missed. ]
Disclaimer
It is important to note that any trade initiated using this screener should be well researched, as the creator is not responsible for any profit or loss incurred.
BankNifty Modified McClellan OscillatorThe McClellan Oscillator developed by Marian McClellan is a useful breadth indicator because it describes the acceleration that takes place in the breadth numbers.
How to read McClellan Oscillator
A positive or negative value gives a simplistic bullish or bearish statement about the short-term trend of the market
Very low readings show oversold conditions
Very high readings show overbought conditions
Divergences are also important to look for as a sign that the strength of a trend is waning
Here same oscillator is rebuilded for BANKNIFTY using the difference between Capital weighted Up Volume and Down Volume instead of Advance - Decline.
