SPY/TLT Strategy█ STRATEGY OVERVIEW
The "SPY/TLT Strategy" is a trend-following crossover strategy designed to trade the relationship between TLT and its Simple Moving Average (SMA). The default configuration uses TLT (iShares 20+ Year Treasury Bond ETF) with a 20-period SMA, entering long positions on bullish crossovers and exiting on bearish crossunders. **This strategy is NOT optimized and performs best in trending markets.**
█ KEY FEATURES
SMA Crossover System: Uses price/SMA relationship for signal generation (Default: 20-period)
Dynamic Time Window: Configurable backtesting period (Default: 2014-2099)
Equity-Based Position Sizing: Default 100% equity allocation per trade
Real-Time Visual Feedback: Price/SMA plot with trend-state background coloring
Event-Driven Execution: Processes orders at bar close for accurate backtesting
█ SIGNAL GENERATION
1. LONG ENTRY CONDITION
TLT closing price crosses ABOVE SMA
Occurs within specified time window
Generates market order at next bar open
2. EXIT CONDITION
TLT closing price crosses BELOW SMA
Closes all open positions immediately
█ ADDITIONAL SETTINGS
SMA Period: Simple Moving Average length (Default: 20)
Start Time and End Time: The time window for trade execution (Default: 1 Jan 2014 - 1 Jan 2099)
Security Symbol: Ticker for analysis (Default: TLT)
█ PERFORMANCE OVERVIEW
Ideal Market Conditions: Strong trending environments
Potential Drawbacks: Whipsaws in range-bound markets
Backtesting results should be analyzed to optimize the MA Period and EMA Filter settings for specific instruments
市場センチメントを測るインジケーター

3 Down, 3 Up Strategy█ STRATEGY DESCRIPTION
The "3 Down, 3 Up Strategy" is a mean-reversion strategy designed to capitalize on short-term price reversals. It enters a long position after consecutive bearish closes and exits after consecutive bullish closes. This strategy is NOT optimized and can be used on any timeframes.
█ WHAT ARE CONSECUTIVE DOWN/UP CLOSES?
- Consecutive Down Closes: A sequence of trading bars where each close is lower than the previous close.
- Consecutive Up Closes: A sequence of trading bars where each close is higher than the previous close.
█ SIGNAL GENERATION
1. LONG ENTRY
A Buy Signal is triggered when:
The price closes lower than the previous close for Consecutive Down Closes for Entry (default: 3) consecutive bars.
The signal occurs within the specified time window (between Start Time and End Time).
If enabled, the close price must also be above the 200-period EMA (Exponential Moving Average).
2. EXIT CONDITION
A Sell Signal is generated when the price closes higher than the previous close for Consecutive Up Closes for Exit (default: 3) consecutive bars.
█ ADDITIONAL SETTINGS
Consecutive Down Closes for Entry: Number of consecutive lower closes required to trigger a buy. Default = 3.
Consecutive Up Closes for Exit: Number of consecutive higher closes required to exit. Default = 3.
EMA Filter: Optional 200-period EMA filter to confirm long entries in bullish trends. Default = disabled.
Start Time and End Time: Restrict trading to specific dates (default: 2014-2099).
█ PERFORMANCE OVERVIEW
Designed for volatile markets with frequent short-term reversals.
Performs best when price oscillates between clear support/resistance levels.
The EMA filter improves reliability in trending markets but may reduce trade frequency.
Backtest to optimize consecutive close thresholds and EMA period for specific instruments.

Buy on 5 day low Strategy█ STRATEGY DESCRIPTION
The "Buy on 5 Day Low Strategy" is a mean-reversion strategy designed to identify potential buying opportunities when the price drops below the lowest low of the previous five days. It enters a long position when specific conditions are met and exits when the price exceeds the high of the previous day. This strategy is optimized for use on daily or higher timeframes.
█ WHAT IS THE 5-DAY LOW?
The 5-Day Low is the lowest price observed over the last five days. This level is used as a reference to identify potential oversold conditions and reversal points.
█ SIGNAL GENERATION
1. LONG ENTRY
A Buy Signal is triggered when:
The close price is below the lowest low of the previous five days (`close < _lowest `).
The signal occurs within the specified time window (between `Start Time` and `End Time`).
2. EXIT CONDITION
A Sell Signal is generated when the current closing price exceeds the high of the previous day (`close > high `). This indicates that the price has shown strength, potentially confirming the reversal and prompting the strategy to exit the position.
█ ADDITIONAL SETTINGS
Start Time and End Time: The time window during which the strategy is allowed to execute trades.
█ PERFORMANCE OVERVIEW
This strategy is designed for mean-reverting markets and performs best when the price frequently oscillates around key support levels.
It is sensitive to oversold conditions, as indicated by the 5-Day Low, and overbought conditions, as indicated by the previous day's high.
Backtesting results should be analyzed to optimize the strategy for specific instruments and market conditions.

3-Bar Low Strategy█ STRATEGY DESCRIPTION
The "3-Bar Low Strategy" is a mean-reversion strategy designed to identify potential buying opportunities when the price drops below the lowest low of the previous three bars. It enters a long position when specific conditions are met and exits when the price exceeds the highest high of the previous seven bars. This strategy is suitable for use on various timeframes.
█ WHAT IS THE 3-BAR LOW?
The 3-Bar Low is the lowest price observed over the last three bars. This level is used as a reference to identify potential oversold conditions and reversal points.
█ WHAT IS THE 7-BAR HIGH?
The 7-Bar High is the highest price observed over the last seven bars. This level is used as a reference to identify potential overbought conditions and exit points.
█ SIGNAL GENERATION
1. LONG ENTRY
A Buy Signal is triggered when:
The close price is below the lowest low of the previous three bars (`close < _lowest `).
The signal occurs within the specified time window (between `Start Time` and `End Time`).
If the EMA Filter is enabled, the close price must also be above the 200-period Exponential Moving Average (EMA).
2. EXIT CONDITION
A Sell Signal is generated when the current closing price exceeds the highest high of the previous seven bars (`close > _highest `). This indicates that the price has shown strength, potentially confirming the reversal and prompting the strategy to exit the position.
█ ADDITIONAL SETTINGS
MA Period: The lookback period for the 200-period EMA used in the EMA Filter. Default is 200.
Use EMA Filter: Enables or disables the EMA Filter for long entries. Default is disabled.
Start Time and End Time: The time window during which the strategy is allowed to execute trades.
█ PERFORMANCE OVERVIEW
This strategy is designed for mean-reverting markets and performs best when the price frequently oscillates around key support and resistance levels.
It is sensitive to oversold conditions, as indicated by the 3-Bar Low, and overbought conditions, as indicated by the 7-Bar High.
Backtesting results should be analyzed to optimize the MA Period and EMA Filter settings for specific instruments.

Bollinger Bands Reversal + IBS Strategy█ STRATEGY DESCRIPTION
The "Bollinger Bands Reversal Strategy" is a mean-reversion strategy designed to identify potential buying opportunities when the price deviates below the lower Bollinger Band and the Internal Bar Strength (IBS) indicates oversold conditions. It enters a long position when specific conditions are met and exits when the IBS indicates overbought conditions. This strategy is suitable for use on various timeframes.
█ WHAT ARE BOLLINGER BANDS?
Bollinger Bands consist of three lines:
- **Basis**: A Simple Moving Average (SMA) of the price over a specified period.
- **Upper Band**: The basis plus a multiple of the standard deviation of the price.
- **Lower Band**: The basis minus a multiple of the standard deviation of the price.
Bollinger Bands help identify periods of high volatility and potential reversal points.
█ WHAT IS INTERNAL BAR STRENGTH (IBS)?
Internal Bar Strength (IBS) is a measure of where the closing price is relative to the high and low of the bar. It is calculated as:
IBS = (Close - Low) / (High - Low)
A low IBS value (e.g., below 0.2) indicates that the close is near the low of the bar, suggesting oversold conditions. A high IBS value (e.g., above 0.8) indicates that the close is near the high of the bar, suggesting overbought conditions.
█ SIGNAL GENERATION
1. LONG ENTRY
A Buy Signal is triggered when:
The IBS value is below 0.2, indicating oversold conditions.
The close price is below the lower Bollinger Band.
The signal occurs within the specified time window (between `Start Time` and `End Time`).
2. EXIT CONDITION
A Sell Signal is generated when the IBS value exceeds 0.8, indicating overbought conditions. This prompts the strategy to exit the position.
█ ADDITIONAL SETTINGS
Length: The lookback period for calculating the Bollinger Bands. Default is 20.
Multiplier: The number of standard deviations used to calculate the upper and lower Bollinger Bands. Default is 2.0.
Start Time and End Time: The time window during which the strategy is allowed to execute trades.
█ PERFORMANCE OVERVIEW
This strategy is designed for mean-reverting markets and performs best when the price frequently deviates from the Bollinger Bands.
It is sensitive to oversold and overbought conditions, as indicated by the IBS, which helps to identify potential reversals.
Backtesting results should be analyzed to optimize the Length and Multiplier parameters for specific instruments.

Average High-Low Range + IBS Reversal Strategy█ STRATEGY DESCRIPTION
The "Average High-Low Range + IBS Reversal Strategy" is a mean-reversion strategy designed to identify potential buying opportunities when the price deviates significantly from its average high-low range and the Internal Bar Strength (IBS) indicates oversold conditions. It enters a long position when specific conditions are met and exits when the price shows strength by exceeding the previous bar's high. This strategy is suitable for use on various timeframes.
█ WHAT IS THE AVERAGE HIGH-LOW RANGE?
The Average High-Low Range is calculated as the Simple Moving Average (SMA) of the difference between the high and low prices over a specified period. It helps identify periods of increased volatility and potential reversal points.
█ WHAT IS INTERNAL BAR STRENGTH (IBS)?
Internal Bar Strength (IBS) is a measure of where the closing price is relative to the high and low of the bar. It is calculated as:
IBS = (Close - Low) / (High - Low)
A low IBS value (e.g., below 0.2) indicates that the close is near the low of the bar, suggesting oversold conditions.
█ SIGNAL GENERATION
1. LONG ENTRY
A Buy Signal is triggered when:
The close price has been below the buy threshold (calculated as `upper - (2.5 * hl_avg)`) for a specified number of consecutive bars (`bars_below_threshold`).
The IBS value is below the specified buy threshold (`ibs_buy_treshold`).
The signal occurs within the specified time window (between `Start Time` and `End Time`).
2. EXIT CONDITION
A Sell Signal is generated when the current closing price exceeds the high of the previous bar (`close > high `). This indicates that the price has shown strength, potentially confirming the reversal and prompting the strategy to exit the position.
█ ADDITIONAL SETTINGS
Length: The lookback period for calculating the average high-low range. Default is 20.
Bars Below Threshold: The number of consecutive bars the price must remain below the buy threshold to trigger a Buy Signal. Default is 2.
IBS Buy Threshold: The IBS value below which a Buy Signal is triggered. Default is 0.2.
Start Time and End Time: The time window during which the strategy is allowed to execute trades.
█ PERFORMANCE OVERVIEW
This strategy is designed for mean-reverting markets and performs best when the price frequently deviates from its average high-low range.
It is sensitive to oversold conditions, as indicated by the IBS, which helps to identify potential reversals.
Backtesting results should be analyzed to optimize the Length, Bars Below Threshold, and IBS Buy Threshold parameters for specific instruments.

Turn of the Month Strategy on Steroids█ STRATEGY DESCRIPTION
The "Turn of the Month Strategy on Steroids" is a seasonal mean-reversion strategy designed to capitalize on price movements around the end of the month. It enters a long position when specific conditions are met and exits when the Relative Strength Index (RSI) indicates overbought conditions. This strategy is optimized for use on daily or higher timeframes.
█ WHAT IS THE TURN OF THE MONTH EFFECT?
The Turn of the Month effect refers to the observed tendency of stock prices to rise around the end of the month. This strategy leverages this phenomenon by entering long positions when the price shows signs of a reversal during this period.
█ SIGNAL GENERATION
1. LONG ENTRY
A Buy Signal is triggered when:
The current day of the month is greater than or equal to the specified `dayOfMonth` threshold (default is 25).
The close price is lower than the previous day's close (`close < close `).
The previous day's close is also lower than the close two days ago (`close < close `).
The signal occurs within the specified time window (between `Start Time` and `End Time`).
There is no existing open position (`strategy.position_size == 0`).
2. EXIT CONDITION
A Sell Signal is generated when the 2-period RSI exceeds 65, indicating overbought conditions. This prompts the strategy to exit the position.
█ ADDITIONAL SETTINGS
Day of Month: The day of the month threshold for triggering a Buy Signal. Default is 25.
Start Time and End Time: The time window during which the strategy is allowed to execute trades.
█ PERFORMANCE OVERVIEW
This strategy is designed to exploit seasonal price patterns around the end of the month.
It performs best in markets where the Turn of the Month effect is pronounced.
Backtesting results should be analyzed to optimize the `dayOfMonth` threshold and RSI parameters for specific instruments.

Consecutive Bars Above/Below EMA Buy the Dip Strategy█ STRATEGY DESCRIPTION
The "Consecutive Bars Above/Below EMA Buy the Dip Strategy" is a mean-reversion strategy designed to identify potential buying opportunities when the price dips below a moving average for a specified number of consecutive bars. It enters a long position when the dip condition is met and exits when the price shows strength by exceeding the previous bar's high. This strategy is suitable for use on various timeframes.
█ WHAT IS THE MOVING AVERAGE?
The strategy uses either a Simple Moving Average (SMA) or an Exponential Moving Average (EMA) as a reference for identifying dips. The type and length of the moving average can be customized in the settings.
█ SIGNAL GENERATION
1. LONG ENTRY
A Buy Signal is triggered when:
The close price is below the selected moving average for a specified number of consecutive bars (`consecutiveBarsTreshold`).
The signal occurs within the specified time window (between `Start Time` and `End Time`).
2. EXIT CONDITION
A Sell Signal is generated when the current closing price exceeds the high of the previous bar (`close > high `). This indicates that the price has shown strength, potentially confirming the reversal and prompting the strategy to exit the position.
█ ADDITIONAL SETTINGS
Consecutive Bars Threshold: The number of consecutive bars the price must remain below the moving average to trigger a Buy Signal. Default is 3.
MA Type: The type of moving average used (SMA or EMA). Default is SMA.
MA Length: The length of the moving average. Default is 5.
Start Time and End Time: The time window during which the strategy is allowed to execute trades.
█ PERFORMANCE OVERVIEW
This strategy is designed for mean-reverting markets and performs best when the price frequently oscillates around the moving average.
It is sensitive to the number of consecutive bars below the moving average, which helps to identify potential dips.
Backtesting results should be analysed to optimize the Consecutive Bars Threshold, MA Type, and MA Length for specific instruments.

Turn around Tuesday on Steroids Strategy█ STRATEGY DESCRIPTION
The "Turn around Tuesday on Steroids Strategy" is a mean-reversion strategy designed to identify potential price reversals at the start of the trading week. It enters a long position when specific conditions are met and exits when the price shows strength by exceeding the previous bar's high. This strategy is optimized for ETFs, stocks, and other instruments on the daily timeframe.
█ WHAT IS THE STARTING DAY?
The Starting Day determines the first day of the trading week for the strategy. It can be set to either Sunday or Monday, depending on the instrument being traded. For ETFs and stocks, Monday is recommended. For other instruments, Sunday is recommended.
█ SIGNAL GENERATION
1. LONG ENTRY
A Buy Signal is triggered when:
The current day is the first day of the trading week (either Sunday or Monday, depending on the Starting Day setting).
The close price is lower than the previous day's close (`close < close `).
The previous day's close is also lower than the close two days ago (`close < close `).
The signal occurs within the specified time window (between `Start Time` and `End Time`).
If the MA Filter is enabled, the close price must also be above the 200-period Simple Moving Average (SMA).
2. EXIT CONDITION
A Sell Signal is generated when the current closing price exceeds the high of the previous bar (`close > high `). This indicates that the price has shown strength, potentially confirming the reversal and prompting the strategy to exit the position.
█ ADDITIONAL SETTINGS
Starting Day: Determines the first day of the trading week. Options are Sunday or Monday. Default is Sunday.
Use MA Filter: Enables or disables the 200-period SMA filter for long entries. Default is disabled.
Start Time and End Time: The time window during which the strategy is allowed to execute trades.
█ PERFORMANCE OVERVIEW
This strategy is designed for markets with frequent weekly reversals.
It performs best in volatile conditions where price movements are significant at the start of the trading week.
Backtesting results should be analysed to optimize the Starting Day and MA Filter settings for specific instruments.

Consecutive Bearish Candle Strategy█ STRATEGY DESCRIPTION
The "Consecutive Bearish Candle Strategy" is a momentum-based strategy designed to identify potential reversals after a sustained bearish move. It enters a long position when a specific number of consecutive bearish candles occur and exits when the price shows strength by exceeding the previous bar's high. This strategy is optimized for use on various timeframes and instruments.
█ SIGNAL GENERATION
1. LONG ENTRY
A Buy Signal is triggered when:
The close price has been lower than the previous close for at least `Lookback` consecutive bars. This indicates a sustained bearish move, suggesting a potential reversal.
The signal occurs within the specified time window (between `Start Time` and `End Time`).
2. EXIT CONDITION
A Sell Signal is generated when the current closing price exceeds the high of the previous bar (`close > high `). This indicates that the price has shown strength, potentially confirming the reversal and prompting the strategy to exit the position.
█ ADDITIONAL SETTINGS
Lookback: The number of consecutive bearish bars required to trigger a Buy Signal. Default is 3.
Start Time and End Time: The time window during which the strategy is allowed to execute trades.
█ PERFORMANCE OVERVIEW
This strategy is designed for markets with frequent momentum shifts.
It performs best in volatile conditions where price movements are significant.
Backtesting results should be analysed to optimize the `Lookback` parameter for specific instruments.

4 Bar Momentum Reversal strategy█ STRATEGY DESCRIPTION
The "4 Bar Momentum Reversal Strategy" is a mean-reversion strategy designed to identify price reversals following a sustained downward move. It enters a long position when a reversal condition is met and exits when the price shows strength by exceeding the previous bar's high. This strategy is optimized for indices and stocks on the daily timeframe.
█ WHAT IS THE REFERENCE CLOSE?
The Reference Close is the closing price from X bars ago, where X is determined by the Lookback period. Think of it as a moving benchmark that helps the strategy assess whether prices are trending upwards or downwards relative to past performance. For example, if the Lookback is set to 4, the Reference Close is the closing price 4 bars ago (`close `).
█ SIGNAL GENERATION
1. LONG ENTRY
A Buy Signal is triggered when:
The close price has been lower than the Reference Close for at least `Buy Threshold` consecutive bars. This indicates a sustained downward move, suggesting a potential reversal.
The signal occurs within the specified time window (between `Start Time` and `End Time`).
2. EXIT CONDITION
A Sell Signal is generated when the current closing price exceeds the high of the previous bar (`close > high `). This indicates that the price has shown strength, potentially confirming the reversal and prompting the strategy to exit the position.
█ ADDITIONAL SETTINGS
Buy Threshold: The number of consecutive bearish bars needed to trigger a Buy Signal. Default is 4.
Lookback: The number of bars ago used to calculate the Reference Close. Default is 4.
Start Time and End Time: The time window during which the strategy is allowed to execute trades.
█ PERFORMANCE OVERVIEW
This strategy is designed for trending markets with frequent reversals.
It performs best in volatile conditions where price movements are significant.
Backtesting results should be analysed to optimize the Buy Threshold and Lookback parameters for specific instruments.

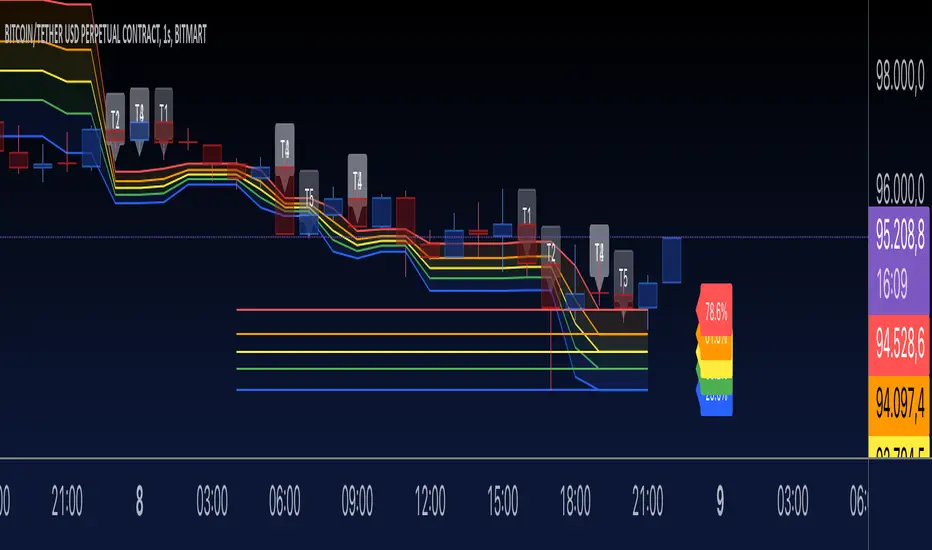
Fibonacci Trend - Aynet1. Inputs
lookbackPeriod: Defines the number of bars to consider for calculating swing highs and lows. Default is 20.
fibLevel1 to fibLevel5: Fibonacci retracement levels to calculate price levels (23.6%, 38.2%, 50%, 61.8%, 78.6%).
useTime: Enables or disables time-based Fibonacci projections.
riskPercent: Defines the percentage of risk for trading purposes (currently not used in calculations).
2. Functions
isSwingHigh(index): Identifies a swing high at the given index, where the high of that candle is higher than both its previous and subsequent candles.
isSwingLow(index): Identifies a swing low at the given index, where the low of that candle is lower than both its previous and subsequent candles.
3. Variables
swingHigh and swingLow: Store the most recent swing high and swing low prices.
swingHighTime and swingLowTime: Store the timestamps of the swing high and swing low.
fib1 to fib5: Fibonacci levels based on the difference between swingHigh and swingLow.
4. Swing Point Detection
The script checks if the last bar is a swing high or swing low using the isSwingHigh() and isSwingLow() functions.
If a swing high is detected:
The high price is stored in swingHigh.
The timestamp of the swing high is stored in swingHighTime.
If a swing low is detected:
The low price is stored in swingLow.
The timestamp of the swing low is stored in swingLowTime.
5. Fibonacci Levels Calculation
If both swingHigh and swingLow are defined, the script calculates the Fibonacci retracement levels (fib1 to fib5) based on the price difference (priceDiff = swingHigh - swingLow).
6. Plotting Fibonacci Levels
Fibonacci levels (fib1 to fib5) are plotted as horizontal lines using the line.new() function.
Labels (e.g., "23.6%") are added near the lines to indicate the level.
Lines and labels are color-coded:
23.6% → Blue
38.2% → Green
50.0% → Yellow
61.8% → Orange
78.6% → Red
7. Filling Between Fibonacci Levels
The plot() function creates lines for each Fibonacci level.
The fill() function is used to fill the space between two levels with semi-transparent colors:
Blue → Between fib1 and fib2
Green → Between fib2 and fib3
Yellow → Between fib3 and fib4
Orange → Between fib4 and fib5
8. Time-Based Fibonacci Projections
If useTime is enabled:
The time difference (timeDiff) between the swing high and swing low is calculated.
Fibonacci time projections are added based on multiples of 23.6%.
If the current time reaches a projected time, a label (e.g., "T1", "T2") is displayed near the high price.
9. Trading Logic
Two placeholder variables are defined for trading logic:
longCondition: Tracks whether a condition for a long trade is met (currently not implemented).
shortCondition: Tracks whether a condition for a short trade is met (currently not implemented).
These variables can be extended to define entry/exit signals based on Fibonacci levels.
How It Works
Detect Swing Points: It identifies recent swing high and swing low points on the chart.
Calculate Fibonacci Levels: Based on the swing points, it computes retracement levels.
Visualize Levels: Plots the levels on the chart with labels and fills between them.
Time Projections: Optionally calculates time-based projections for future price movements.
Trading Opportunities: The framework provides tools for detecting potential reversal or breakout zones using Fibonacci levels.
HOD/LOD/PMH/PML/PDH/PDL Strategy by @tradingbauhaus This script is a trading strategy @tradingbauhaus designed to trade based on key price levels, such as the High of Day (HOD), Low of Day (LOD), Premarket High (PMH), Premarket Low (PML), Previous Day High (PDH), and Previous Day Low (PDL). Below, I’ll explain in detail what the script does:
Core Functionality of the Script:
Calculates Key Price Levels:
HOD (High of Day): The highest price of the current day.
LOD (Low of Day): The lowest price of the current day.
PMH (Premarket High): The highest price during the premarket session (before the market opens).
PML (Premarket Low): The lowest price during the premarket session.
PDH (Previous Day High): The highest price of the previous day.
PDL (Previous Day Low): The lowest price of the previous day.
Draws Horizontal Lines on the Chart:
Plots horizontal lines on the chart for each key level (HOD, LOD, PMH, PML, PDH, PDL) with specific colors for easy visual identification.
Defines Entry and Exit Rules:
Long Entry (Buy): If the price crosses above the PMH (Premarket High) or the PDH (Previous Day High).
Short Entry (Sell): If the price crosses below the PML (Premarket Low) or the PDL (Previous Day Low).
Long Exit: If the price reaches the HOD (High of Day) during a long position.
Short Exit: If the price reaches the LOD (Low of Day) during a short position.
How the Script Works Step by Step:
Calculates Key Levels:
Uses the request.security function to fetch the HOD and LOD of the current day, as well as the highs and lows of the previous day (PDH and PDL).
Calculates the PMH and PML during the premarket session (before 9:30 AM).
Plots Levels on the Chart:
Uses the plot function to draw horizontal lines on the chart representing the key levels (HOD, LOD, PMH, PML, PDH, PDL).
Each level has a specific color for easy identification:
HOD: White.
LOD: Purple.
PDH: Orange.
PDL: Blue.
PMH: Green.
PML: Red.
Defines Trading Rules:
Uses conditions with ta.crossover and ta.crossunder to detect when the price crosses key levels.
Long Entry: If the price crosses above the PMH or PDH, a long position (buy) is opened.
Short Entry: If the price crosses below the PML or PDL, a short position (sell) is opened.
Long Exit: If the price reaches the HOD during a long position, the position is closed.
Short Exit: If the price reaches the LOD during a short position, the position is closed.
Executes Orders Automatically:
Uses the strategy.entry and strategy.close functions to open and close positions automatically based on the defined rules.
Advantages of This Strategy:
Based on Key Levels: Uses important price levels that often act as support and resistance.
Easy to Visualize: Horizontal lines on the chart make it easy to identify levels.
Automated: Entries and exits are executed automatically based on the defined rules.
Limitations of This Strategy:
Dependent on Volatility: Works best in markets with significant price movements.
False Crosses: There may be false crosses that generate incorrect signals.
No Advanced Risk Management: Does not include dynamic stop-loss or take-profit mechanisms.
How to Improve the Strategy:
Add Stop-Loss and Take-Profit: To limit losses and lock in profits.
Filter Signals with Indicators: Use RSI, MACD, or other indicators to confirm signals.
Optimize Levels: Adjust key levels based on the asset’s behavior.
In summary, this script is a trading strategy that operates based on key price levels, such as HOD, LOD, PMH, PML, PDH, and PDL. It is useful for traders who want to trade based on significant support and resistance levels.

Mean Reversion V-FThis strategy workings on high volatile stock or crypto assets
It using 5 dynamic band's to get in the long position.
In same time depends on the band increases the units of the asset to get in the next position.
The unit's of the asset can be adjusted. Make sure to adjust the unit for different asset.
The bands are determined of main SMA.
There is no stop loss.
Take profit is trialing - HMA or % or average price + take profit - note if you use % trailing back test is not realistic but is working on real time.
Deviations can be adjust depends on the asset volatility.

McClellan A-D Volume Integration ModelThe strategy integrates the McClellan A-D Oscillator with an adjustment based on the Advance/Decline (A-D) volume data. The McClellan Oscillator is calculated by taking the difference between the short-term and long-term exponential moving averages (EMAs) of the A-D line. This strategy introduces an enhancement where the A-D volume (the difference between the advancing and declining volume) is factored in to adjust the oscillator value.
Inputs:
• ema_short_length: The length for the short-term EMA of the A-D line.
• ema_long_length: The length for the long-term EMA of the A-D line.
• osc_threshold_long: The threshold below which the oscillator must drop for an entry signal to trigger.
• exit_periods: The number of periods after which the position is closed.
• Data Sources:
• ad_advance and ad_decline are the data sources for advancing and declining issues, respectively.
• vol_advance and vol_decline are the volume data for the advancing and declining issues. If volume data is unavailable, it defaults to na (Not Available), and the fallback logic ensures that the strategy continues to function.
McClellan Oscillator with Volume Adjustment:
• The A-D line is calculated by subtracting the declining issues from the advancing issues. Then, the volume difference is applied to this line, creating a “weighted” A-D line.
• The short and long EMAs are calculated for the weighted A-D line to generate the McClellan Oscillator.
Entry Condition:
• The strategy looks for a reversal signal, where the oscillator falls below the threshold and then rises above it again. The condition is designed to trigger a long position when this reversal happens.
Exit Condition:
• The position is closed after a set number of periods (exit_periods) have passed since the entry.
Plotting:
• The McClellan Oscillator and the threshold are plotted on the chart for visual reference.
• Entry and exit signals are highlighted with background colors to make the signals more visible.
Scientific Background:
The McClellan A-D Oscillator is a popular market breadth indicator developed by Sherman and Marian McClellan. It is used to gauge the underlying strength of a market by analyzing the difference between the number of advancing and declining stocks. The oscillator is typically calculated using exponential moving averages (EMAs) of the A-D line, with the idea being that crossovers of these EMAs indicate potential changes in the market’s direction.
The integration of A-D volume into this model adds another layer of analysis, as volume is often considered a leading indicator of price movement. By factoring in volume, the strategy becomes more sensitive to not just the number of advancing or declining stocks but also how significant those movements are based on trading volume, as discussed in Schwager, J. D. (1999). Technical Analysis of the Financial Markets. This enhanced version aims to capture stronger and more sustainable trends in the market, helping to filter out false signals.
Additionally, volume analysis is often used to confirm price movements, as described in Wyckoff, R. (1931). The Day Trading System. Therefore, incorporating the volume of advancing and declining stocks in the McClellan Oscillator offers a more robust signal for trading decisions.

three Supertrend EMA Strategy by Prasanna +DhanuThe indicator described in your Pine Script is a Supertrend EMA Strategy that combines the Supertrend and EMA (Exponential Moving Average) to create a trend-following strategy. Here’s a detailed breakdown of how this indicator works:
1. EMA (Exponential Moving Average):
The EMA is a moving average that places more weight on recent prices, making it more responsive to price changes compared to a simple moving average (SMA). In this strategy, the EMA is used to determine the overall trend direction.
Input Parameter:
ema_length: This is the period for the EMA, set to 50 periods by default. A shorter EMA will respond more quickly to price movements, while a longer EMA is smoother and less sensitive to short-term fluctuations.
How it's used:
If the price is above the EMA, it indicates an uptrend.
If the price is below the EMA, it indicates a downtrend.
2. Supertrend Indicator:
The Supertrend indicator is a trend-following tool based on the Average True Range (ATR), which is a volatility measure. It helps to identify the direction of the trend by setting a dynamic support or resistance level.
Input Parameters:
supertrend_atr_period: The period used for calculating the ATR, set to 10 periods by default.
supertrend_multiplier1: Multiplier for the first Supertrend, set to 3.0.
supertrend_multiplier2: Multiplier for the second Supertrend, set to 2.0.
supertrend_multiplier3: Multiplier for the third Supertrend, set to 1.0.
Each Supertrend line has a different multiplier, which affects its sensitivity to price changes. The ATR period defines how many periods of price data are used to calculate the ATR.
How the Supertrend works:
If the Supertrend value is below the price, the trend is considered bullish (uptrend).
If the Supertrend value is above the price, the trend is considered bearish (downtrend).
The Supertrend will switch between up and down based on price movement and ATR, providing a dynamic trend-following signal.
3. Three Supertrend Lines:
In this strategy, three Supertrend lines are calculated with different multipliers and the same ATR period (10 periods). Each line is more or less sensitive to price changes, and they are plotted on the chart in different colors based on whether the trend is bullish (green) or bearish (red).
Supertrend 1: The most sensitive Supertrend with a multiplier of 3.0.
Supertrend 2: A moderately sensitive Supertrend with a multiplier of 2.0.
Supertrend 3: The least sensitive Supertrend with a multiplier of 1.0.
Each Supertrend line signals a bullish trend when its value is below the price and a bearish trend when its value is above the price.
4. Strategy Rules:
This strategy uses the three Supertrend lines combined with the EMA to generate trade signals.
Entry Conditions:
A long entry is triggered when all three Supertrend lines are in an uptrend (i.e., all three Supertrend lines are below the price), and the price is above the EMA. This suggests a strong bullish market condition.
A short entry is triggered when all three Supertrend lines are in a downtrend (i.e., all three Supertrend lines are above the price), and the price is below the EMA. This suggests a strong bearish market condition.
Exit Conditions:
A long exit occurs when the third Supertrend (the least sensitive one) switches to a downtrend (i.e., the price falls below it).
A short exit occurs when the third Supertrend switches to an uptrend (i.e., the price rises above it).
5. Visualization:
The strategy also plots the following on the chart:
The EMA is plotted as a blue line, which helps identify the overall trend.
The three Supertrend lines are plotted with different colors:
Supertrend 1: Green (for uptrend) and Red (for downtrend).
Supertrend 2: Green (for uptrend) and Red (for downtrend).
Supertrend 3: Green (for uptrend) and Red (for downtrend).
Summary of the Strategy:
The strategy combines three Supertrend indicators (with different multipliers) and an EMA to capture both short-term and long-term trends.
Long positions are entered when all three Supertrend lines are bullish and the price is above the EMA.
Short positions are entered when all three Supertrend lines are bearish and the price is below the EMA.
Exits occur when the third Supertrend line (the least sensitive) signals a change in trend direction.
This combination of indicators allows for a robust trend-following strategy that adapts to both short-term volatility and long-term trend direction. The Supertrend lines provide quick reaction to price changes, while the EMA offers a smoother, more stable trend direction for confirmation.
The indicator described in your Pine Script is a Supertrend EMA Strategy that combines the Supertrend and EMA (Exponential Moving Average) to create a trend-following strategy. Here’s a detailed breakdown of how this indicator works:
1. EMA (Exponential Moving Average):
The EMA is a moving average that places more weight on recent prices, making it more responsive to price changes compared to a simple moving average (SMA). In this strategy, the EMA is used to determine the overall trend direction.
Input Parameter:
ema_length: This is the period for the EMA, set to 50 periods by default. A shorter EMA will respond more quickly to price movements, while a longer EMA is smoother and less sensitive to short-term fluctuations.
How it's used:
If the price is above the EMA, it indicates an uptrend.
If the price is below the EMA, it indicates a downtrend.
2. Supertrend Indicator:
The Supertrend indicator is a trend-following tool based on the Average True Range (ATR), which is a volatility measure. It helps to identify the direction of the trend by setting a dynamic support or resistance level.
Input Parameters:
supertrend_atr_period: The period used for calculating the ATR, set to 10 periods by default.
supertrend_multiplier1: Multiplier for the first Supertrend, set to 3.0.
supertrend_multiplier2: Multiplier for the second Supertrend, set to 2.0.
supertrend_multiplier3: Multiplier for the third Supertrend, set to 1.0.
Each Supertrend line has a different multiplier, which affects its sensitivity to price changes. The ATR period defines how many periods of price data are used to calculate the ATR.
How the Supertrend works:
If the Supertrend value is below the price, the trend is considered bullish (uptrend).
If the Supertrend value is above the price, the trend is considered bearish (downtrend).
The Supertrend will switch between up and down based on price movement and ATR, providing a dynamic trend-following signal.
3. Three Supertrend Lines:
In this strategy, three Supertrend lines are calculated with different multipliers and the same ATR period (10 periods). Each line is more or less sensitive to price changes, and they are plotted on the chart in different colors based on whether the trend is bullish (green) or bearish (red).
Supertrend 1: The most sensitive Supertrend with a multiplier of 3.0.
Supertrend 2: A moderately sensitive Supertrend with a multiplier of 2.0.
Supertrend 3: The least sensitive Supertrend with a multiplier of 1.0.
Each Supertrend line signals a bullish trend when its value is below the price and a bearish trend when its value is above the price.
4. Strategy Rules:
This strategy uses the three Supertrend lines combined with the EMA to generate trade signals.
Entry Conditions:
A long entry is triggered when all three Supertrend lines are in an uptrend (i.e., all three Supertrend lines are below the price), and the price is above the EMA. This suggests a strong bullish market condition.
A short entry is triggered when all three Supertrend lines are in a downtrend (i.e., all three Supertrend lines are above the price), and the price is below the EMA. This suggests a strong bearish market condition.
Exit Conditions:
A long exit occurs when the third Supertrend (the least sensitive one) switches to a downtrend (i.e., the price falls below it).
A short exit occurs when the third Supertrend switches to an uptrend (i.e., the price rises above it).
5. Visualization:
The strategy also plots the following on the chart:
The EMA is plotted as a blue line, which helps identify the overall trend.
The three Supertrend lines are plotted with different colors:
Supertrend 1: Green (for uptrend) and Red (for downtrend).
Supertrend 2: Green (for uptrend) and Red (for downtrend).
Supertrend 3: Green (for uptrend) and Red (for downtrend).
Summary of the Strategy:
The strategy combines three Supertrend indicators (with different multipliers) and an EMA to capture both short-term and long-term trends.
Long positions are entered when all three Supertrend lines are bullish and the price is above the EMA.
Short positions are entered when all three Supertrend lines are bearish and the price is below the EMA.
Exits occur when the third Supertrend line (the least sensitive) signals a change in trend direction.
This combination of indicators allows for a robust trend-following strategy that adapts to both short-term volatility and long-term trend direction. The Supertrend lines provide quick reaction to price changes, while the EMA offers a smoother, more stable trend direction for confirmation.

Harmony Signal Flow By ArunThis Pine Script strategy, titled "Harmony Signal Flow By Arun," uses the Relative Strength Index (RSI) indicator to generate buy and sell signals based on custom thresholds. The script incorporates stop-loss and target management and restricts new trades until the previous position closes. Here's a detailed description:
Custom RSI Metric:
The strategy calculates a 5-period RSI based on the closing price, aiming for a more responsive measure of price momentum.
RSI thresholds are defined:
Lower threshold (30): Indicates oversold conditions, triggering a potential buy.
Upper threshold (70): Indicates overbought conditions, prompting a possible sell.
Entry Conditions:
Buy Signal: The strategy initiates a buy order when the RSI crosses above the lower threshold (30), indicating a shift from oversold conditions.
Sell Signal: A sell order is triggered when the RSI crosses below the upper threshold (70), suggesting an overbought reversal.
Only one order (buy or sell) can be active at a time, ensuring that a new trade begins only when there’s no existing position.
Stop-Loss and Target Management:
For each trade, stop-loss and target conditions are applied to manage risk and secure profits.
For Buy Positions:
Stop-loss is set 100 points below the entry price.
Target is set 150 points above the entry price.
For Sell Positions:
Stop-loss is set 100 points above the entry price.
Target is 150 points below the entry price.
The strategy closes the trade when either the stop-loss or target is met, marking the trade as "closed" and allowing a new trade entry.
Trade Sequencing:
A new trade (buy or sell) is only permitted after the previous position hits either its stop-loss or target, preventing overlapping trades and ensuring clear trade sequences.
This sequential approach enhances risk management by ensuring only one active position at any time.
End-of-Day Closure:
All open positions are closed automatically at 3:25 PM (Indian market time) to avoid overnight exposure, ensuring the strategy remains strictly intraday.
The flag for trade entry is reset at the end of each day, enabling fresh trades the next day.
Chart Indicators:
The script plots buy and sell signals directly on the chart with visible labels.
It also displays the custom RSI metric with horizontal lines for the lower and upper thresholds, providing visual cues for entry and exit points.
Summary
This strategy is a momentum-based intraday trading approach that uses the RSI for identifying potential reversals and manages trades through predefined stop-loss and target levels. By enforcing trade sequencing and closing positions at the end of the trading day, it prioritizes risk management and seeks to capitalize on short-term trends while avoiding overnight market risks.

Gabriel's Witcher Strategy [65 Minute Trading Bot]Strategy Description: Gabriel's Witcher Strategy
Author: Gabriel
Platform: TradingView Pine Script (Version 5)
Backtested Asset: Avalanche (Coinbase Brokage for Volume adjustment)
Timeframe: 65 Minutes
Strategy Type: Comprehensive Trend-Following and Momentum Strategy with Scalping and Risk Management Features
Overview
Gabriel's Witcher Strategy is an advanced trading bot designed for the Avalanche pair on a 65-minute timeframe. This strategy integrates a multitude of technical indicators to identify and execute high-probability trading opportunities. By combining trend-following, momentum, volume analysis, and range filtering, the strategy aims to capitalize on both long and short market movements. Additionally, it incorporates scalping mechanisms and robust risk management features, including take-profit (TP) levels and commission considerations, to optimize trade performance and profitability.
====Key Components====
Source Selection:
Custom Source Flexibility: Allows traders to select from a wide range of price and volume sources (e.g., Close, Open, High, Low, HL2, HLC3, OHLC4, VWAP, On-Balance Volume, etc.) for indicator calculations, enhancing adaptability to various trading styles.
Various curves of Volume Analysis are employed:
Tick Volume Calculation: Utilizes tick volume as a fallback when actual volume data is unavailable, ensuring consistency across different data feeds.
Volume Indicators: Incorporates multiple volume-based indicators such as On-Balance Volume (OBV), Accumulation/Distribution (AccDist), Negative Volume Index (NVI), Positive Volume Index (PVI), and Price Volume Trend (PVT) for comprehensive market analysis.
Trend Indicators:
ADX (Average Directional Index): Measures trend strength using either the Classic or Masanakamura method, with customizable length and threshold settings. It's used to open positions when the mesured trend is strong, or exit when its weak.
Jurik Moving Average (JMA): A smooth moving average that reduces lag, configurable with various parameters including source, resolution, and repainting options.
Parabolic SAR: Identifies potential reversals in market trends with adjustable start, increment, and maximum settings.
Custom Trend Indicator: Utilizes highest and lowest price points over a specified timeframe to determine current and previous trend bases, visually represented with color-filled areas.
Momentum Indicators:
Relative Strength Index (RSI): Evaluates the speed and change of price movements, smoothed with a custom length and source. It's used to not enter the market for shorts in oversold or longs for overbought conditions, and to enter for long in oversold or shorts for overboughts.
Momentum-Based Calculations: Employs both Double Exponential Moving Averages (DEMA) on a MACD-based RSI to enhance momentum signal accuracy which is then further accelerated by a Hull MA. This is the technical analysis tool that determines bearish or bullish momentum.
OBV-Based Momentum Conditions: Uses two exponential moving averages of OBV to determine bullish or bearish momentum shifts, anomalities, breakouts where banks flow their funds in or Smart Money Concepts trade.
Moving Averages (MA):
Multiple MA Types: Includes Simple Moving Average (SMA), Exponential Moving Average (EMA), Weighted Moving Average (WMA), Hull Moving Average (HMA), and Volume-Weighted Moving Average (VWMA), selectable via input parameters.
MA Speed Calculation: Measures the percentage change in MA values to determine the direction and speed of the trend.
Range Filtering:
Variance-Based Filter: Utilizes variance and moving averages to filter out trades during low-volatility periods, enhancing trade quality.
Color-Coded Range Indicators: Visualizes range filtering with color changes on the chart for quick assessment.
Scalping Mechanism:
Heikin-Ashi Candles: Optionally uses Heikin-Ashi candles for smoother price action analysis.
EMA-Based Trend Detection: Employs fast, medium, and slow EMAs to determine trend direction and potential entry points.
Fractal-Based Filtering: Detects regular or BW (Black & White) fractals to confirm trade signals.
Take Profit (TP) Management:
Dynamic TP Levels: Calculates TP levels based on the number of consecutive long or short entries, adjusting targets to maximize profits.
TP Signals and Re-Entry: Plots TP signals on the chart and allows for automatic re-entry upon TP hit, maintaining continuous trade flow.
Risk Management:
Commission Integration: Accounts for trading commissions to ensure net profitability.
Position Sizing: Configured to use a percentage of equity for each trade, adjustable via input parameters.
Pyramiding: Allows up to one additional position per direction to enhance gains during strong trends.
Alerts and Visual Indicators:
Buy/Sell Signals: Plots visual indicators (triangles and flags) on the chart to signify entry and TP points.
Bar Coloring: Changes bar colors based on ADX and trend conditions for immediate visual cues.
Price Levels: Marks significant price levels related to TP and position entries with cross styles.
Input Parameters
Source Settings:
Custom Sources (srcinput): Choose from various price and volume sources to tailor indicator calculations.
ADX Settings:
ADX Type (ADX_options): Select between 'CLASSIC' and 'MASANAKAMURA' methods.
ADX Length (ADX_len): Defines the period for ADX calculation.
ADX Threshold (th): Sets the minimum ADX value to consider a strong trend.
RSI Settings:
RSI Length (len_3): Period for RSI calculation.
RSI Source (src_3): Source data for RSI.
Trend Strength Settings:
Channel Length (n1): Period for trend channel calculation.
Average Length (n2): Period for smoothing trend strength.
Jurik Moving Average (JMA) Settings:
JMA Source (inp): Source data for JMA.
JMA Resolution (reso): Timeframe for JMA calculation.
JMA Repainting (rep): Option to allow JMA to repaint.
JMA Length (lengths): Period for JMA.
Parabolic SAR Settings:
SAR Start (start): Initial acceleration factor.
SAR Increment (increment): Acceleration factor increment.
SAR Maximum (maximum): Maximum acceleration factor.
SAR Point Width (width): Visual width of SAR points.
Trend Indicator Settings:
Trend Timeframe (timeframe): Period for trend indicator calculations.
Momentum Settings:
Source Type (srcType): Select between 'Price' and 'VWAP'.
Momentum Source (srcPrice): Source data for momentum calculations.
RSI Length (rsiLen): Period for momentum RSI.
Smooth Length (sLen): Smoothing period for momentum RSI.
OBV Settings:
OBV Line 1 (e1): EMA period for OBV line 1.
OBV Line 2 (e2): EMA period for OBV line 2.
Moving Average (MA) Settings:
MA Length (length): Period for MA calculations.
MA Type (matype): Select MA type (1: SMA, 2: EMA, 3: HMA, 4: WMA, 5: VWMA).
Range Filter Settings:
Range Filter Length (length0): Period for range filtering.
Range Filter Multiplier (mult): Multiplier for range variance.
Take Profit (TP) Settings:
TP Long (tp_long0): Percentage for long TP.
TP Short (tp_short0): Percentage for short TP.
Scalping Settings:
Scalping Activation (ACT_SCLP): Enable or disable scalping.
Scalping Length (HiLoLen): Period for scalping indicators.
Fast EMA Length (fastEMAlength): Period for fast EMA in scalping.
Medium EMA Length (mediumEMAlength): Period for medium EMA in scalping.
Slow EMA Length (slowEMAlength): Period for slow EMA in scalping.
Filter (filterBW): Enable or disable additional fractal filtering.
Pullback Lookback (Lookback): Number of bars for pullback consideration.
Use Heikin-Ashi Candles (UseHAcandles): Option to use Heikin-Ashi candles for smoother trend analysis.
Strategy Logic
Indicator Calculations:
Volume and Source Selection: Determines the primary data source based on user input, ensuring flexibility and adaptability.
ADX Calculation: Computes ADX using either the Classic or Masanakamura method to assess trend strength.
RSI Calculation: Evaluates market momentum using RSI, further smoothed with custom periods.
Trend Strength Assessment: Utilizes trend channel and average lengths to gauge the robustness of current trends.
Jurik Moving Average (JMA): Smooths price data to reduce lag and enhance trend detection.
Parabolic SAR: Identifies potential trend reversals with adjustable parameters for sensitivity.
Momentum Analysis: Combines RSI with DEMA and OBV-based conditions to confirm bullish or bearish momentum.
Moving Averages: Employs multiple MA types to determine trend direction and speed.
Range Filtering: Filters out low-volatility periods to focus on high-probability trades.
Trade Conditions:
Long Entry Conditions:
ADX Confirmation: ADX must be above the threshold, indicating a strong uptrend.
RSI and Momentum: RSI below 70 and positive momentum signals.
JMA and SAR: JMA indicates an uptrend, and Parabolic SAR is below the price.
Trend Indicator: Confirms the current trend direction.
Range Filter: Ensures market is in an upward range.
Scalping Option: If enabled, additional scalping conditions must be met.
Short Entry Conditions:
ADX Confirmation: ADX must be above the threshold, indicating a strong downtrend.
RSI and Momentum: RSI above 30 and negative momentum signals.
JMA and SAR: JMA indicates a downtrend, and Parabolic SAR is above the price.
Trend Indicator: Confirms the current trend direction.
Range Filter: Ensures market is in a downward range.
Scalping Option: If enabled, additional scalping conditions must be met.
Position Management:
Entry Execution: Places long or short orders based on the identified conditions and user-selected position types (Longs, Shorts, or Both).
Take Profit (TP): Automatically sets TP levels based on predefined percentages, adjusting dynamically with consecutive trades.
Re-Entry Mechanism: Allows for automatic re-entry upon TP hit, maintaining active trading positions.
Exit Conditions: Closes positions when TP levels are reached or when opposing trend signals are detected.
Visual Indicators:
Bar Coloring: Highlights bars in green for bullish conditions, red for bearish, and orange for neutral.
Plotting Price Levels: Marks significant price levels related to TP and trade entries with cross symbols.
Signal Shapes: Displays triangle and flag shapes on the chart to indicate trade entries and TP hits.
Alerts:
Custom Alerts: Configured to notify traders of long entries, short entries, and TP hits, enabling timely trade management and execution.
Usage Instructions
Setup:
Apply the Strategy: Add the script to your TradingView chart set to BTCUSDT with a 65-minute timeframe.
Configure Inputs: Adjust the input parameters under their respective groups (e.g., Source Settings, ADX, RSI, Trend Strength, etc.) to match your trading preferences and risk tolerance.
Position Selection:
Choose Position Type: Use the Position input to select Longs, Shorts, or Both based on your market outlook.
Execution: The strategy will automatically execute and manage positions according to the selected type, ensuring targeted trading actions.
Signal Interpretation:
Buy Signals: Blue triangles below the bars indicate potential long entry points.
Sell Signals: Red triangles above the bars indicate potential short entry points.
Take Profit Signals: Flags above or below the bars signify TP hits for long and short positions, respectively.
Bar Colors: Green bars suggest bullish conditions, red bars indicate bearish conditions, and orange bars represent neutral or consolidating markets.
Risk Management:
Default Position Size: Set to 100% of equity. Adjust the default_qty_value as needed for your risk management strategy.
Commission: Accounts for a 0.1% commission per trade. Adjust the commission_value to match your broker's fees.
Pyramiding: Allows up to one additional position per direction to enhance gains during strong trends.
Backtesting and Optimization:
Historical Testing: Utilize TradingView's backtesting features to evaluate the strategy's performance over historical data.
Parameter Tuning: Optimize input parameters to align the strategy with current market dynamics and personal trading objectives.
Alerts Configuration:
Set Up Alerts: Enable and configure alerts based on the predefined alertcondition statements to receive real-time notifications of trade signals and TP hits.
Additional Features
Comprehensive Indicator Integration: Combines multiple technical indicators to provide a holistic view of market conditions, enhancing trade signal accuracy.
Scalping Options: Offers an optional scalping mechanism to capitalize on short-term price movements, increasing trading flexibility.
Dynamic Take Profit Levels: Adjusts TP targets based on the number of consecutive trades, maximizing profit potential during favorable trends.
Advanced Volume Analysis: Utilizes various volume indicators to confirm trend strength and validate trade signals.
Customizable Range Filtering: Filters trades based on market volatility, ensuring trades are taken during optimal conditions.
Heikin-Ashi Candle Support: Optionally uses Heikin-Ashi candles for smoother price action analysis and reduced noise.
====Recommendations====
Thorough Backtesting:
Historical Performance: Before deploying the strategy in a live trading environment, perform comprehensive backtesting to understand its performance under various market conditions. These are the premium settings for Avalanche Coinbase.
Optimization: Regularly review and adjust input parameters to ensure the strategy remains effective amidst changing market volatility and trends. Backtest the strategy for each crypto and make sure you are in the right brokage when using the volume sources as it will affect the overall outcome of the trading strategy.
Risk Management:
Position Sizing: Adjust the default_qty_value to align with your risk tolerance and account size.
Stop-Loss Implementation: Although the strategy includes TP levels, they're also consided to be a stop-loss mechanisms to protect against adverse market movements.
Commission Adjustment: Ensure the commission_value accurately reflects your broker's fees to maintain realistic backtesting results. Generally, 0.1~0.3% are most of the average broker's comission fees.
Slipage: The slip comssion is 1 Tick, since the strategy is adjusted to only enter/exit on bar close where most positions are available.
Continuous Monitoring:
Strategy Performance: Regularly monitor the strategy's performance to ensure it operates as expected and make adjustments as needed. A max-drawndown hit has been added to operate in case the premium Avalanche settings go wrong, but you can turn it off an adjust the equity percentage to 50% if you are confortable with the high volatile max-drown or even 100% if your account allows you to borrow cash.
Customization:
Indicator Parameters: Tailor indicator settings (e.g., ADX length, RSI period, MA types) to better fit your specific trading style and market conditions.
Scalping Options: Enable or disable scalping based on your trading preferences and risk appetite.
Conclusion
Gabriel's Witcher Strategy is a robust and versatile trading solution designed to navigate the complexities of the Crypto market. By integrating a wide array of technical indicators and providing extensive customization options, this strategy empowers traders to execute informed and strategic trades. Its comprehensive approach, combining trend analysis, momentum detection, volume evaluation, and range filtering, ensures that trades are taken during optimal market conditions. Additionally, the inclusion of scalping features and dynamic take-profit management enhances the strategy's adaptability and profitability potential. Unlike any trading strategy, with both diligent testing and continuous monitoring under the strategy tester, it's possible to achieve sustained success by adjusting the settings to the individual Crypto that need it, for example this one is preset for Avalanche Coinbase 65 Miinutes but it can be adjust for BTCUSD or Etherium if you backtest and search for the right settings.

DMR By ANTExplanation of the DMR by ANT Script
a. What is This Script and How Is It Useful?
This Pine Script, named "DMR by ANT, " is designed for use on TradingView, focusing on dynamically assessing market conditions. It calculates key levels, specifically the high and low of the previous two days, to establish trading zones that assist traders in making informed decisions.
The script highlights:
Previous Day's High and Low : It captures the high and low prices from the previous two days to help set up trading ranges.
First 15 Minutes Candles High and low is marked with Orange Lines .
Trade Zones : It identifies whether the current price is in a 'tradeable' zone or 'non-tradeable' zone. The zones are determined based on the relationship between the current price, today's open price, and the calculated high and low levels.
Targets and Stop Losses : The script dynamically provides target and stop-loss levels based on user-defined input points, which can help manage risk effectively.
This script is beneficial for traders looking to enter (or avoid) trades based on defined price action criteria and can effectively streamline the analysis process in fast-moving markets.
Customize Input Parameters:(settings)
Adjust the ATR, based on ATR target and stop-loss is calculated and displayed. The default values 7(rest see the help), Dynamics changes based on ATR values changes in real time.
b. How to Effectively Use This Script
The DMR script can be utilized across various trading instruments, including:
Indexes: Suitable for gauging market sentiment and overall trends; can assist in short-term trading strategies.
Options: Helps determine the likely movement of the underlying assets, providing insight into probable volatility and directional bias.
ETFs (Exchange-Traded Funds): Useful for trading diversified portfolios; traders can define entry and exit points relevant to the basket of stocks.
Stocks: Ideal for individual stock trading, as traders can analyze stock movements concerning broader market trends.
When utilizing this script, traders should:
Identify key trading levels before entering trades based on the calculated high and low ranges.
Use the dynamic targets and stop-loss levels to protect capital and maximize potential gains.
Continuously monitor the script's signals and adapt to ongoing market changes.
c. Best Time Frames for Different Instruments
The optimal time frames for using the DMR script can vary based on the trading instrument.
Here’s a summary in tabular format for clearer guidance:
Instrument Best Time Frames
Index 5-minute, 15-minute, 1-hour
Options 1-minute, 5-minute, 15-minute
ETF 5-minute, 15-minute, 1-hour
Stocks 5-minute, 15-minute, 1-hour, Daily
Indexes: Shorter time frames (5 to 15 minutes) can capture quick market movements, while 1-hour frames can provide a broader market overview.
Options Trading: Given the time sensitivity of options, using very short time frames (1-5 minutes) can be effective to seize rapid price movements before expiry.
ETFs: Similar to indices, shorter frames help in effectively tracking movements of the underlying assets.
Stocks: A mix of short (5-15 minutes) for day trading and daily charts for swing trading can provide balanced insights.
Conclusion
Utilizing the DMR by ANT script can greatly enhance a trader's ability to analyze market conditions, identify opportunities, and manage risk effectively. By adapting the script through the different listed recommendations, traders can maximize their trading strategy’s effectiveness across various instruments.
Do comment below for further improvement.

Fibonacci & Bollinger Bands StrategyThis strategy combines Bollinger Bands and Fibonacci retracement/extension levels to identify potential entry and exit points in the market. Here’s a breakdown of each component and how the strategy works:
1. Bollinger Bands:
Bollinger Bands consist of a simple moving average (SMA) and two standard deviations (upper and lower bands) plotted above and below the SMA. The bands expand and contract based on market volatility.
Purpose in Strategy:
The lower band represents an area where the market might be oversold.
The upper band represents an area where the market might be overbought.
The price crossing these bands suggests overextended market conditions, which can be used to identify potential reversals.
2. Fibonacci Retracement and Extension Levels:
Fibonacci retracement levels are horizontal lines that indicate where price might find support or resistance as it retraces some of its previous movement. Common retracement levels are 61.8% and 78.6%.
Fibonacci extension levels are used to project areas where the price might extend after completing a retracement. These levels can help determine potential targets after a significant price movement.
Purpose in Strategy:
The strategy calculates the most recent swing high (fibHigh) and swing low (fibLow) over a lookback period. It then plots Fibonacci retracement and extension levels based on this range.
The Fibonacci levels are used as key support and resistance areas. The price approaching or touching these levels signals potential turning points in the market.
3. Entry Criteria:
A long position (buy) is triggered when:
The price crosses below the lower Bollinger Band, indicating an oversold condition.
The price is near or above a Fibonacci extension level (calculated based on the most recent price swing).
This suggests that the price is potentially reaching a strong support area, where a reversal is likely.
4. Exit Criteria:
The long position is closed (exit trade) when either:
The price touches or crosses the upper Bollinger Band, signaling an overbought condition.
The price reaches a Fibonacci retracement level or exceeds the recent swing high (fibHigh), indicating a potential exhaustion point or a reversal area.
5. General Strategy Logic:
The strategy takes advantage of market volatility (captured by the Bollinger Bands) and key support/resistance levels (determined by Fibonacci retracement and extension levels).
By combining these two techniques, the strategy identifies potential entry points at oversold levels with the expectation that the market will retrace or reverse upward, especially when near key Fibonacci extension levels.
Exit points are identified by potential overbought levels (Bollinger upper band) or key Fibonacci retracement levels, where the price might reverse downward.
6. Conditions to Execute the Strategy:
The Fibonacci levels are only calculated once the price has made a significant movement, establishing a recent high and low over a 50-bar period (which you can adjust). This ensures the Fibonacci levels are based on meaningful swings.
The entry and exit signals are filtered using both Bollinger Bands and Fibonacci levels to ensure that trades are not taken solely based on one indicator, thus reducing false signals.
Key Features of the Strategy:
Trend-following with reversal: It tries to catch reversals when the price hits extreme levels (Bollinger Bands) while respecting important Fibonacci levels.
Dynamic market adaptation: The strategy adapts to market conditions as it recalculates Fibonacci levels based on recent price swings and adjusts the Bollinger Bands for market volatility.
Confirmation through multiple indicators: It uses both the volatility-based signals from Bollinger Bands and the price structure from Fibonacci levels to confirm trade entries and exits.
Summary of the Strategy:
The strategy looks to buy low and sell high based on oversold/overbought signals from Bollinger Bands and Fibonacci levels that indicate key support and resistance zones.
By combining these two technical indicators, the strategy aims to reduce risk and increase accuracy by only entering trades when both indicators suggest favorable conditions.

Gold Scalping Strategy with Precise EntriesThe Gold Scalping Strategy with Precise Entries is designed to take advantage of short-term price movements in the gold market (XAU/USD). This strategy uses a combination of technical indicators and chart patterns to identify precise buy and sell opportunities during times of consolidation and trend continuation.
Key Elements of the Strategy:
Exponential Moving Averages (EMAs):
50 EMA: Used as the shorter-term moving average to detect the recent price trend.
200 EMA: Used as the longer-term moving average to determine the overall market trend.
Trend Identification:
A bullish trend is identified when the 50 EMA is above the 200 EMA.
A bearish trend is identified when the 50 EMA is below the 200 EMA.
Average True Range (ATR):
ATR (14) is used to calculate the market's volatility and to set a dynamic stop loss based on recent price movements. Higher ATR values indicate higher volatility.
ATR helps define a suitable stop-loss distance from the entry point.
Relative Strength Index (RSI):
RSI (14) is used as a momentum oscillator to detect overbought or oversold conditions.
However, in this strategy, the RSI is primarily used as a consolidation filter to look for neutral zones (between 45 and 55), which may indicate a potential breakout or trend continuation after a consolidation phase.
Engulfing Patterns:
Bullish Engulfing: A bullish signal is generated when the current candle fully engulfs the previous bearish candle, indicating potential upward momentum.
Bearish Engulfing: A bearish signal is generated when the current candle fully engulfs the previous bullish candle, signaling potential downward momentum.
Precise Entry Conditions:
Long (Buy):
The 50 EMA is above the 200 EMA (bullish trend).
The RSI is between 45 and 55 (neutral/consolidation zone).
A bullish engulfing pattern occurs.
The price closes above the 50 EMA.
Short (Sell):
The 50 EMA is below the 200 EMA (bearish trend).
The RSI is between 45 and 55 (neutral/consolidation zone).
A bearish engulfing pattern occurs.
The price closes below the 50 EMA.
Take Profit and Stop Loss:
Take Profit: A fixed 20-pip target (where 1 pip = 0.10 movement in gold) is used for each trade.
Stop Loss: The stop-loss is dynamically set based on the ATR, ensuring that it adapts to current market volatility.
Visual Signals:
Buy and sell signals are visually plotted on the chart using green and red labels, indicating precise points of entry.
Advantages of This Strategy:
Trend Alignment: The strategy ensures that trades are taken in the direction of the overall trend, as indicated by the 50 and 200 EMAs.
Volatility Adaptation: The use of ATR allows the stop loss to adapt to the current market conditions, reducing the risk of premature exits in volatile markets.
Precise Entries: The combination of engulfing patterns and the neutral RSI zone provides a high-probability entry signal that captures momentum after consolidation.
Quick Scalping: With a fixed 20-pip profit target, the strategy is designed to capture small price movements quickly, which is ideal for scalping.
This strategy can be applied to lower timeframes (such as 1-minute, 5-minute, or 15-minute charts) for frequent trade opportunities in gold trading, making it suitable for day traders or scalpers. However, proper risk management should always be used due to the inherent volatility of gold.

Breadth Thrust Strategy with Volatility Stop-LossThe "Breadth Thrust Strategy with Volatility Stop-Loss" is a trading strategy designed to capitalize on market momentum while managing risk through volatility-based stop-losses. Here's a detailed breakdown of the strategy:
Strategy Overview:
Market Breadth Analysis: The strategy uses the "Breadth Thrust Indicator," which evaluates market momentum by calculating the ratio of advancing stocks to the total number of stocks on the New York Stock Exchange (NYSE). This indicator helps identify bullish market conditions. An optional feature allows for the inclusion of volume data in this calculation, enhancing the signal's robustness.
Signal Generation: A long position is triggered when the smoothed breadth ratio (or the combined breadth and volume ratio) crosses above a specified low threshold (e.g., 0.4). This crossover indicates a potential shift towards positive market momentum.
Key Parameters:
Smoothing Length (length): Defines the period over which the breadth or combined ratio is smoothed using a simple moving average (SMA) to reduce noise and highlight the underlying trend.
Low Threshold (threshold_low): The level below which the smoothed ratio must fall before crossing back above to trigger a long signal.
Hold Periods (hold_periods): The minimum number of periods for which the position will be held once entered, ensuring the strategy captures a meaningful move.
Volatility Multiplier (volatility_multiplier): A multiplier applied to the Average True Range (ATR) to determine the distance of the stop-loss from the entry price, which adjusts according to market volatility.
Trade Management:
Entry Signal: The strategy enters a long position when the smoothed combined ratio crosses above the low threshold, signaling a potential bullish reversal.
ATR-Based Stop-Loss: Upon entering a trade, the strategy calculates a stop-loss level based on the ATR, which measures market volatility. The stop-loss is set at a distance from the entry price, determined by multiplying the ATR by the specified volatility multiplier. This adaptive stop-loss mechanism helps protect the position from adverse market moves.
Stop-Loss Adjustment: While the position is open, the stop-loss level is dynamically updated, ensuring it never decreases (trailing stop-loss effect) but can be adjusted upwards to reflect the latest price action relative to volatility.
Position Closure: The position is closed if:
The market price falls to or below the stop-loss level.
The position has been held for the specified number of periods (hold_periods), after which it is automatically closed.
Additional Settings:
Initial Capital: The strategy starts with an initial capital of $10,000.
Commissions and Slippage: Each trade incurs a commission of $5 per order, and slippage is accounted for at $1 per trade.
Background Highlighting: The chart background turns green when a position is open, providing a clear visual indication of the active trade.
This strategy is designed to identify and capitalize on upward momentum in the market while employing a volatility-adjusted stop-loss to manage risk. By combining market breadth analysis with volatility-based stop-losses, the strategy aims to balance profit potential with protection against sudden market reversals.

Trend Catcher Strategywhat is Trend Catcher Strategy?
it is a strategy that opens long or short positions in the direction of the trend.
what it does?
TCS detects trend formations using its own unique method. Then, it opens a position in the direction of the trend and closes a part of the opened transaction (half according to default values) when the price reaches a certain level, and moves the remaining position to the point where it thinks the trend is over. You can easily understand how it works by looking at the images:
how it does it?
It obtains a value called a "limit" by dividing the difference between the highest value and the lowest value in a certain range (that is, the vector sum) to the sum of the lengths of the candles in a certain range (the total distance traveled). then multiplies this by 100 to get a percentage value. The closer this value is to 100, the stronger the trend.
