9:30 USA OPENEasy if it go up it will turn green and you can lng if it goes down it will turn red and you can short
市場センチメントを測るインジケーター

MACD / AO Alineación (V21) PublicA long or short indicator for any timeframe. It's important to consider volatility and ADX to find the most appropriate momentum. There are also other details to consider.
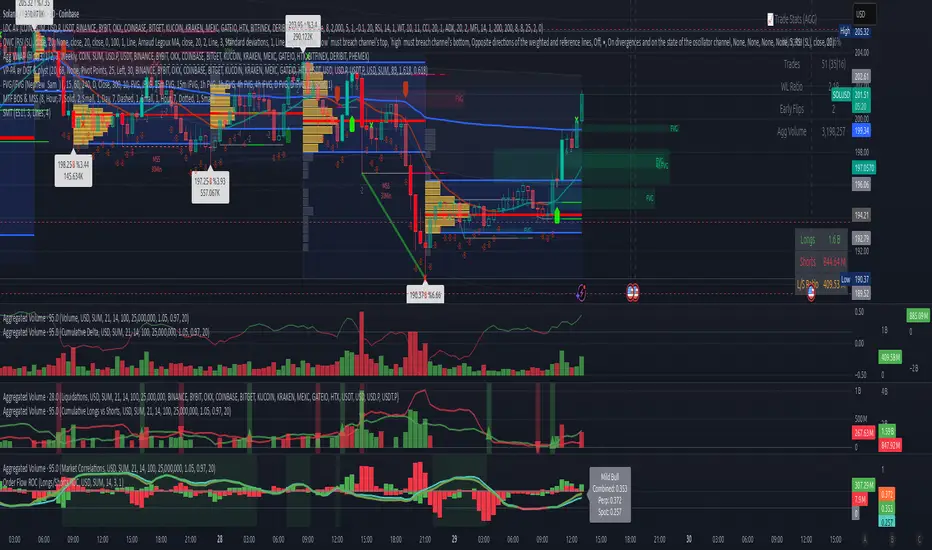
Volume Aggregated Spot & Futures -- Crypto (by plyst & more)📊 Volume Aggregated Spot & Futures - Enhanced Edition
🎯 Overview
Advanced volume aggregation indicator that combines spot and perpetual futures volume across the top 10 cryptocurrency exchanges. This enhanced version builds upon the original work by @HALDRO Project with optimized calculations and expanded functionality.
✨ Key Features
- 📈 Real-time aggregated volume from 10 major exchanges (Binance, Bybit, OKX, Coinbase, Bitget, KuCoin, Kraken, MEXC, Gate.io, HTX)
- 🔄 Multiple visualization modes: Volume, Delta, Cumulative Delta, Spot vs Perp analysis, Liquidations, OBV, and MFI
- 💱 Multi-currency support: Display volume in COIN, USD, or EUR
- 🎨 Clean, single-color bar chart showing total cumulative volume
- 📊 Multiple calculation methods: SUM, AVG, MEDIAN, VARIANCE
- 🎯 Separate spot (USDT, USD, USDC, etc.) and perpetual futures (.P contracts) tracking
🔧 Technical Improvements
✓ Corrected MFI formula for accurate money flow calculations
✓ Optimized volume aggregation logic with proper NA handling
✓ Support for 10 exchanges (up from 9)
✓ Streamlined codebase for better performance
✓ Updated perpetual contract naming conventions (.P format)
📖 Usage
Perfect for analyzing total market volume, identifying liquidation events, tracking buyer/seller pressure through delta analysis, and understanding the spot vs futures market dynamics.
🙏 Credits
Original concept and framework by @HALDRO Project. This version includes mathematical corrections, code optimizations, and expanded exchange support.
⚠️ Note
Aggregated volume is calculated from external exchange data using request.security(). Ensure your plan supports the necessary security calls for optimal performance.
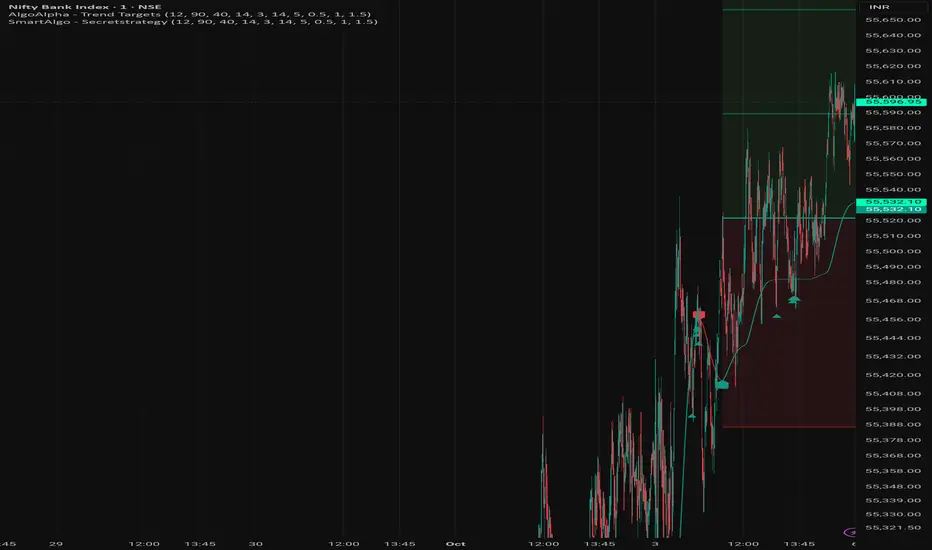
Secret strategy[Smartalgo]We are revealing our secret trading strategy through Tradingview indicator
FEATURES
Trend Detection: Automatically identifies trend direction using a smoothed Supertrend (WMA + EMA), with shape markers on trend shifts and color-coded bars for clarity.
snapshot
Rejection Signals: Detects price rejections at the trend line after a user-defined number of consolidation bars; plots ▲/▼ icons to highlight strong continuation setups.
snapshot
Target Projection: On trend confirmation, plots entry, stop-loss (ATR-based), and three dynamic take-profit levels based on customizable
snapshot
multiples.
Dynamic Updates: All levels (entry, SL, TP1–TP3) auto-adjust based on volatility and are labeled in real time on the chart.
Customization: Users can tweak trend parameters, rejection confirmation count, SL/TP ratios, smoothing lengths, and appearance settings.
Alerts: Built-in alerts for trend changes, rejection events, and when TP1, TP2, or TP3 are reached.
Chart Overlay: Plots directly on price chart with minimal clutter and clearly labeled levels for easy trading.
king amun king gold**Features:**
- ✓ Ability to enable/disable each indicator individually
- ✓ Colors that change depending on the indicator's direction
- ✓ Different line thicknesses (EMA: thick, SMA: thin)
- ✓ Fully customizable settings
ATH Line with Date (Editable)Overview:
This indicator draws a continuous horizontal line at the instrument’s All-Time High (ATH) and annotates it with a label that shows the date the ATH was set in dd-mmm-yyyy format. The label is fully configurable (text prefix, side, position, colors, vertical offset), and you can optionally append the ATH price formatted as $ 1.234,56. Built for Pine Script™ v6 and works on any symbol or timeframe.
How it works
• Maintains a running maximum of high.
• Detects the bar where the current ATH occurred and extracts its date.
• Renders a horizontal line extended both sides at the ATH level.
• Places an optional label on the last bar or on the ATH bar.
• Triggers an optional alert when a new ATH is printed.
Inputs
• Line color / width / style – customize the ATH line appearance.
• Show label – toggle label on/off.
• Label text (prefix) – default ATH ►.
• Label text color / background – visual customization for the tag.
• Label side – left or right-anchored label.
• X location – Last bar or ATH bar.
• Label vertical offset (%) – moves the label above/below the line.
• Show price – appends the ATH price in the format $ 1.234,56
Notes & behavior:
• Repainting: The ATH level is stable until a higher high appears. When a new ATH is set, the line and date update accordingly—this is expected behavior.
• The ATH is computed from the chart’s current timeframe/history. If the symbol has limited history on your chart, the ATH reflects only the available data.
• No external libraries; no user data is collected.
Alerts:
• Includes New ATH alert condition. Fire it to be notified when price sets a new all-time high.
Tips:
• Use Last bar placement to keep the label visible at the right edge while scrolling.
• If the label overlaps candles or drawings, add a small positive vertical offset.
Version:
• Pine Script™ v6. Indicator only; no trading signals or orders.
Disclaimer:
For educational purposes only. This script does not constitute financial advice or a recommendation to buy or sell any security. Always do your own research and manage risk appropriately.

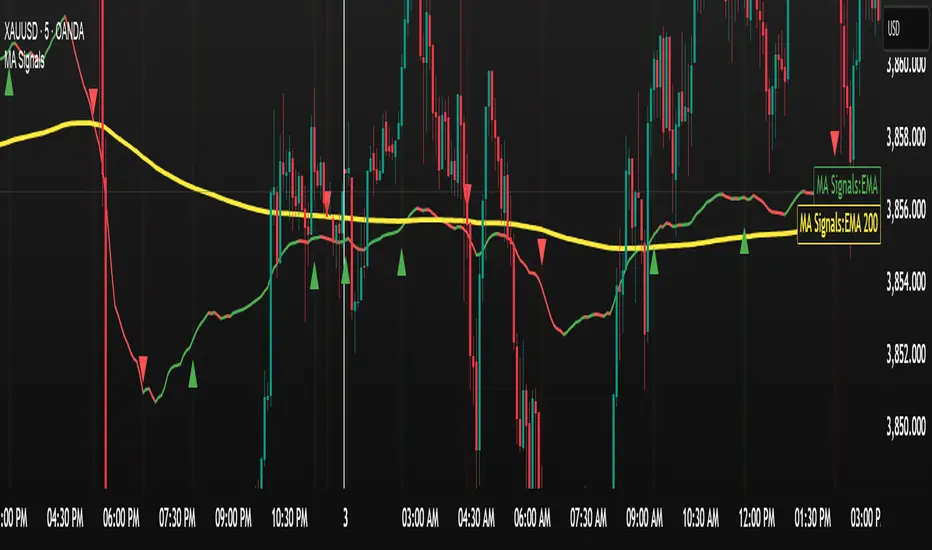
3SMA (1H only) by tophengzkyThis script plots three Simple Moving Averages (SMA 10, 20, 50), but they are only visible when the chart timeframe is set to 1 hour (1H).
It helps traders focus on higher timeframe trend direction without cluttering charts on other timeframes.
SMA1 = 10 (white)
SMA2 = 20 (yellow)
SMA3 = 200 (red)
Works only on 1H timeframe
Useful for swing traders and intraday traders who rely on hourly trend confirmation.
why 1 hr only? the only purpose of this is just to know the bias of the market weather it will reverse or it will continue the trend. As long as the price action did not cross this 3 SMA's the trend will continue.
as a trend trader it is very useful this strategy.. make it simple!

EBCLUB 📌 Indicator Summary – XAUUSD (Fano Chart)
This indicator is designed for traders who work with Smart Money (SMC/ICT) concepts and need a clear reading of key levels and market imbalances.
🔑 Key Features:
Daily and Weekly Levels:
Open Day: Opens the daily session to clearly define the range reference.
PDL/PDH (Previous Day Low/High): High-impact levels used as liquidity magnets.
Current Day High (H4 or Intraday): Tracks short-term structures.
Market Sessions (UTC):
Visualizes which session is active (London, New York, Tokyo, Sydney).
Helps identify when volatility tends to increase.
Liquidity Blocks and Institutional Zones:
Indicates areas of imbalance and accumulation (colored rectangles).
Facilitates the identification of possible entries or continuations.

Sentiment Navigator|SuperFundedSentiment Navigator — Momentum × Volatility Heatmap
What it is
Sentiment Navigator blends momentum (RSI) with volatility (ATR normalized by price) to visualize market psychology using a background heatmap and a lower oscillator.
・Background: quick read of the market’s “temperature” → Extreme Greed / Greed / Neutral / Fear / Extreme Fear.
・Oscillator: a bounded sentiment score from -100 to +100 showing bias strength and potential extremes.
Why this is not a simple mashup
Instead of showing RSI and ATR separately, this tool integrates them into a single, weighted score and a state machine:
・Context-aware weighting: When volatility is high (ATR vs its SMA baseline), the score is amplified, reflecting that momentum matters more in turbulent regimes.
・Unified states: RSI thresholds classify regimes (Greed/Fear) and are conditioned by volatility to promote Extreme states only when justified.
・Actionable cues: Reversal labels appear at the extreme levels with candle confirmation to reduce noise.
How it works (concise)
1. Momentum: RSI(len) (default 21).
2. Volatility: ATR(len)/close*100 (default ATR=14), smoothed by SMA(volSmaLen) and compared using volMultiplier.
3. Sentiment score: transform RSI to (-100..+100) via (RSI-50)*2, then amplify ×1.5 when high volatility. Finally clamp to .
4. States:
・RSI > greedLevel → Greed (upgraded to Extreme Greed if high vol)
・RSI < fearLevel → Fear (upgraded to Extreme Fear if high vol)
・else Neutral
5. Plotting:
・Oscillator (area) with 0-line and dotted extreme bands.
・Background color by state (greens for Greed, reds for Fear, gray for Neutral).
6. Signals (optional):
・Buy: crossover(score, -extremeGreedLevel) and close > open → prints ▲ at -extremeGreedLevel
・Sell: crossunder(score, extremeGreedLevel) and close < open → prints ▼ at +extremeGreedLevel
Parameters (UI mapping)
Core
・RSI Length (rsiLen)
・ATR Length (atrLen)
・Volatility SMA Length (volSmaLen)
・High-Vol Multiplier (volMultiplier)
State thresholds
・Extreme Greed (extremeGreedLevel)
・Greed (greedLevel)
・Fear (fearLevel)
・Extreme Fear (extremeFearLevel)
Display
・Show Background (showBgColor)
・Show Reversal Signals (showSignals)
Practical usage
・Regime read: Treat greens as risk-on bias, reds as risk-off, gray as indecision.
・Entries: Use ▲/▼ as triggers, not commands—wait for price action (wicks/engulfings) at structure.
・Extreme management: At Extreme states, favor mean-reversion tactics; in plain Greed/Fear with low vol, trends may persist longer.
・Tuning:
・Raise greedLevel/fearLevel to reduce signals.
・Increase volMultiplier to demand stronger vol for “Extreme” states.
Repainting & confirmation
Signals rely on cross events of the oscillator; judge on bar close for stricter rules. Background/state can change intrabar as RSI/ATR evolve.
Disclaimer
No indicator guarantees outcomes. News/liquidity can override signals. Trade responsibly with proper risk controls.
SuperFunded invite-only
To obtain access, please DM me on TradingView or use the link in my profile.
Sentiment Navigator — クイックガイド(日本語)
概要
本インジは RSI(モメンタム) と ATR/価格(ボラティリティ) を統合し、背景のヒートマップと下部オシレーターで市場心理を可視化します。
・背景色:極度の強欲 / 強欲 / 中立 / 恐怖 / 極度の恐怖 を直感表示。
・オシレーター:-100〜+100 のスコアでバイアスの強さと過熱を示します。
独自性・新規性
・高ボラ状態ではスコアを増幅し、同じRSIでも環境次第で体感インパクトを反映。
・RSIしきい値×ボラで極端ゾーンの発生を制御し、意義のあるExtremeのみ点灯。
・反転ラベルは極端レベルのクロス+ローソク条件で点灯し、ノイズを抑制。
仕組み(要点)
1. RSI を算出。
2. ATR/close*100 を SMA と比較し、しきい値倍率で高ボラを判定。
3. score = (RSI-50)*2 を 高ボラで×1.5、 にクランプ。
4. 状態:RSI>Greed → Greed/Extreme Greed、RSI

Wolfhis code is a Range Filter with entry signals.
How it works:
It calculates the average candle range (the difference between the price and its previous value) using EMA.
Based on this range, it builds a filter — a “smoothed line” (central level) along with upper and lower bands.
If the price moves above the filter → uptrend (green zone). If it moves below → downtrend (red zone).
Trade conditions:
longCondition (buy): price is above the filter and the filter has turned upward.
shortCondition (sell): price is below the filter and the filter has turned downward.
On the chart it displays:
the filter (line),
upper/lower bands,
colored candles (if enabled),
BUY/SELL labels and alerts.
In simple terms: it’s an indicator that filters out market noise and shows when the price changes trend direction, giving entry signals.

Horizontal Lines [White]The Horizontal Lines indicator is a simple yet powerful visual tool designed for traders in forex, options, and other financial markets. It allows users to mark and track key price levels directly on their chart with clear, bright yellow lines.

BTC Pro – Modular v6 (Final Version with Clean Labels)A complete Bitcoin charting toolkit built for clarity and decision-making.
✅ EMA levels (21, 50, 200, 800)
✅ Daily EMA 50 (constant across timeframes)
✅ SuperTrend for directional bias
✅ Liquidity zones based on ±2×ATR around SMA50
✅ On-Balance Volume (manual calculation)
✅ ADX trend strength with threshold labeling
✅ RSI divergence detection (bullish/bearish)
✅ Market structure: HH/LL breaks
✅ Entry zones with auto-generated SL/TP boxes
✅ Clean right-side labels (stacked)
✅ Modular toggles for full control via settings
Created by WhyPhy – modular, readable, and ready for live use.

Horizontal Lines [Yellow]The Horizontal Lines indicator is a simple yet powerful visual tool designed for traders in forex, options, and other financial markets. It allows users to mark and track key price levels directly on their chart with clear, bright yellow lines.

VWAP Trio: Continuous + London-anchored + NY-anchoredThis indicator plots three different VWAPs at once so you can see how price behaves against:
Continuous VWAP
Starts from the beginning of the whole chart / instrument history and keeps going.
Acts like a long-term “fair value” line.
London-anchored VWAP
Resets (anchors) at the London session open (usually 08:00 London).
Shows the average price paid during the current London session.
Day traders use it to see if price is trending or mean-reverting during the EU morning.
NY-anchored VWAP
Resets at the New York session open (usually 08:00 NY / 13:00–14:30 London depending on DST).
Shows the average price for the U.S. session.

fartbombLinReg fit (history): solid line showing the best-fit linear trend over the last len bars.
Projected offset (visual): same line shifted h bars right so you can see direction.
Future projection (segments): the actual next-h forecast, drawn from the last bar.
Forecast made h bars ago: circle at each bar’s target showing what was predicted h bars earlier.
H / X markers: a hit if that earlier forecast fell inside the bar’s high–low range.

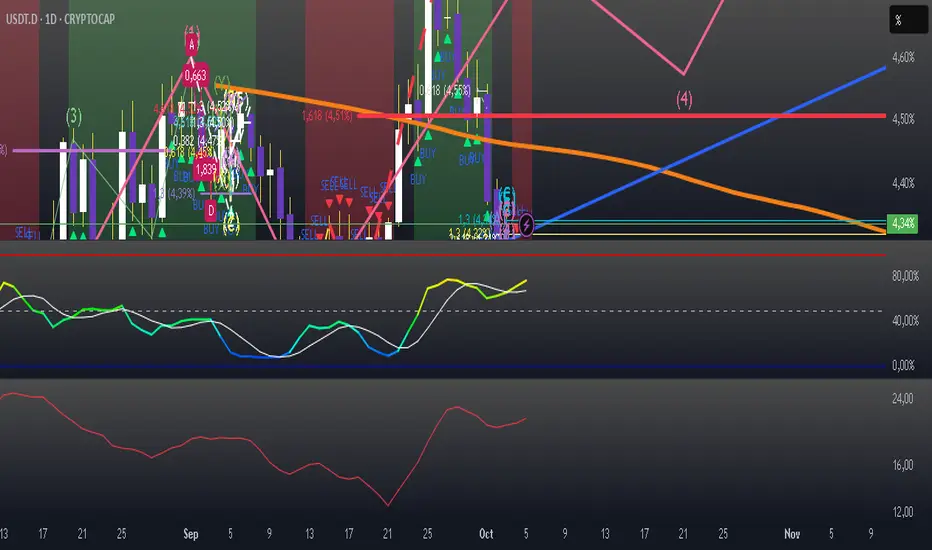
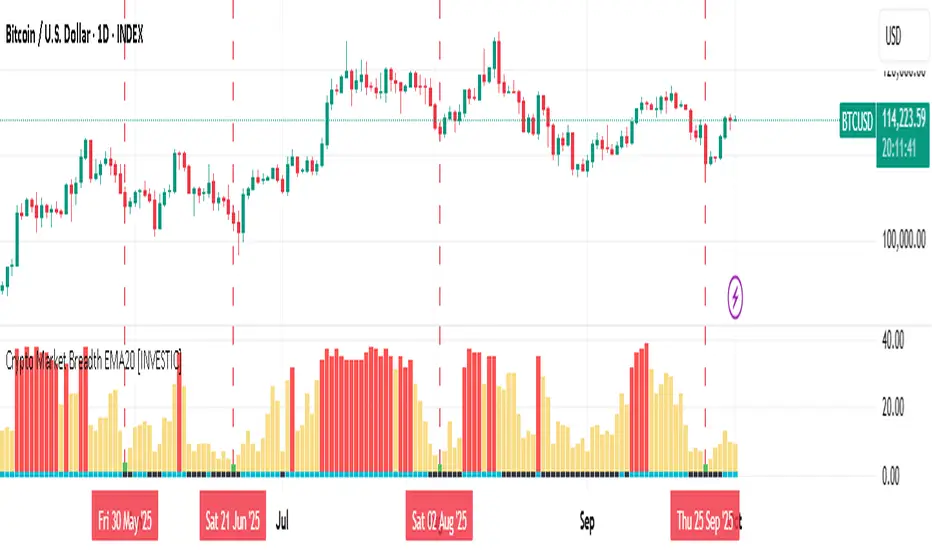
Crypto Market Breadth EMA20 [INVESTIC]This indicator is designed to provide a broad overview of the cryptocurrency market’s health by measuring how many of the top 40 crypto assets are trading above a user-selected moving average (MA). Instead of focusing on just Bitcoin, it evaluates the market as a whole, making it useful for spotting market extremes such as panic-driven selloffs or overheated rallies.
The concept is inspired by Market Breadth Analysis often used in stock markets, but here it is specifically adapted to the crypto space, offering traders a unique perspective on overall sentiment and strength.
How to Interpret the Indicator
The indicator consists of two main components:
Main Histogram (Market Breadth)
Bottom Line (Bitcoin’s Position)
1. Main Histogram (Market Breadth)
🟢 Green Bars: Triggered when fewer than 5 cryptocurrencies are trading above their MA. This often reflects a Panic Sell situation, where extreme fear dominates the market. Such capitulation zones historically provide higher probabilities of price rebounds in both Bitcoin and altcoins.
🔴 Red Bars: Triggered when 32 or more cryptocurrencies trade above their MA. This suggests the market is becoming overheated, with most assets already in strong rallies. While this may confirm a strong bullish trend, it can also indicate a potential market top and serves as a cautionary signal.
🟡 Yellow Bars: Represent neutral or consolidating market conditions.
2. Bottom Line (Bitcoin’s Position)
🔵 Aqua: Bitcoin is above the selected MA.
⚫️ Black: Bitcoin is below the selected MA.
This additional layer helps traders align Bitcoin’s individual trend with the broader crypto market condition.
Customization and Settings
This indicator is fully customizable to suit different trading strategies:
Timeframe: Can be applied to any timeframe, from intraday to long-term charts.
Moving Average (MA): Users can select the type (EMA, SMA, WMA) and adjust the length.
For beginners, the default setting of EMA 20 is recommended as a baseline. More experienced traders are encouraged to experiment with different MA types and lengths to better match their personal strategies.
Key Advantages and Uniqueness
Unlike standard trend indicators, this tool focuses on breadth across multiple assets rather than a single price.
Adaptation of stock market breadth techniques specifically for cryptocurrencies.
Helps identify extreme conditions (capitulation or overheated rallies) that are often hidden when only looking at Bitcoin or a single indicator.
Disclaimer
This indicator is for educational and research purposes only. It does not constitute financial advice. Always perform your own analysis and risk management before making trading or investment decisions.
Nifty Market Breadth Analyzer# 📊 Nifty Market Breadth Analyzer
## Overview
Professional-grade market breadth indicator specifically designed for Indian equity markets (NSE). Analyzes strength across 7 major Nifty indices to provide comprehensive market health assessment and timing signals.
## 🎯 Key Features
### Multi-Index Analysis
- Tracks Nifty 50, CNX 500, Bank Nifty, Midcap 150, Smallcap 250, Microcap 250
- Calculates composite breadth score (0-100%)
- Shows participation rate (how many indices are strong)
### Smart Signal Generation
- **Entry Signals**: When breadth crosses bullish threshold (60%)
- **Exit Signals**: When breadth weakens below neutral (40%)
- **Strong Signals**: Extreme strength/weakness alerts (>70% or <30%)
- **Bottom Detection**: Automatic identification of market capitulation & recovery
### Divergence Detection
- **Bullish Divergence**: Price falling but breadth improving (bottom forming)
- **Bearish Divergence**: Price rising but breadth weakening (rally losing steam)
### Visual Dashboard
- Real-time breadth score with color coding
- Individual index status (✓ or ✗ above MA)
- Current market condition (Strong Bullish to Strong Bearish)
- Trading signal recommendation (GO LONG, EXIT ALL, WAIT)
- Trend direction (Rising/Falling/Stable)
## 📈 Use Cases
✅ **Bottom Hunting**: Identify capitulation zones and reversal points
✅ **Trend Confirmation**: Enter only when broad market supports the move
✅ **Risk Management**: Exit when breadth deteriorates even if price holds
✅ **Market Analysis**: Distinguish between narrow and broad-based rallies
✅ **Divergence Trading**: Catch reversals before price confirms
## 🧮 Methodology
The indicator calculates a composite score for each index based on:
1. **Trend**: Is price above 50-period moving average?
2. **Momentum**: Is 14-period RSI above 50?
3. **Acceleration**: Is 20-period rate of change positive?
Final breadth = Average score across all enabled indices
## ⚙️ Customization
**Thresholds**: Adjust bullish/bearish levels to match your risk tolerance
**Indices**: Select which indices to include in calculation
**Technical**: Modify MA length, RSI period, smoothing
**Visual**: Toggle histogram, signals, zones, and dashboard
## 📊 Interpretation Guide
| Breadth Score | Condition | Action |
|--------------|-----------|---------|
| 70-100% | 🚀 Strong Bullish | Add positions, hold long |
| 60-70% | 📈 Bullish | Safe to enter long |
| 40-60% | ➡️ Neutral | Wait for clarity |
| 30-40% | 📉 Bearish | Exit longs, reduce exposure |
| 0-30% | ⚠️ Strong Bearish | Exit all, watch for bottom |
## 🎓 Best Practices
1. **Don't fight breadth**: Avoid going long when breadth < 40%
2. **Wait for confirmation**: Multiple indices must turn positive
3. **Use with price action**: Combine with support/resistance levels
4. **Set alerts**: Get notified of breadth changes in real-time
5. **Monitor divergences**: These often precede major reversals
## 🔔 Recommended Alerts
- Market Bottom Confirmed (breadth recovers from <30%)
- Breadth Entry Signal (crosses above 60%)
- Breadth Exit Signal (crosses below 40%)
- Bullish/Bearish Divergence Detected
## 💡 Pro Tips
- Extreme breadth (<30%) often marks capitulation bottoms
- 5+ indices above MA = healthy broad-based rally
- Rising breadth + falling price = excellent buying opportunity
- Falling breadth + rising price = distribution warning
## 🌐 Best For
- Intraday traders (use on 5-15 min timeframes)
- Swing traders (use on 1-hour to daily)
- Position traders (use on daily to weekly)
- Portfolio managers monitoring market health
## ⚠️ Important Notes
- Ensure symbol names match your data provider
- Works best on Nifty 50 chart or related indices
- Not suitable for individual stock analysis
- Past performance doesn't guarantee future results
## 📞 Support & Updates
Found this helpful? Please boost, comment, and follow for updates!
Suggestions welcome - continuously improving based on user feedback.
---
**Version**: 1.0
**Last Updated**:
**Indicator Type**: Market Breadth / Oscillator
**Timeframe**: All (optimized for 15min+)

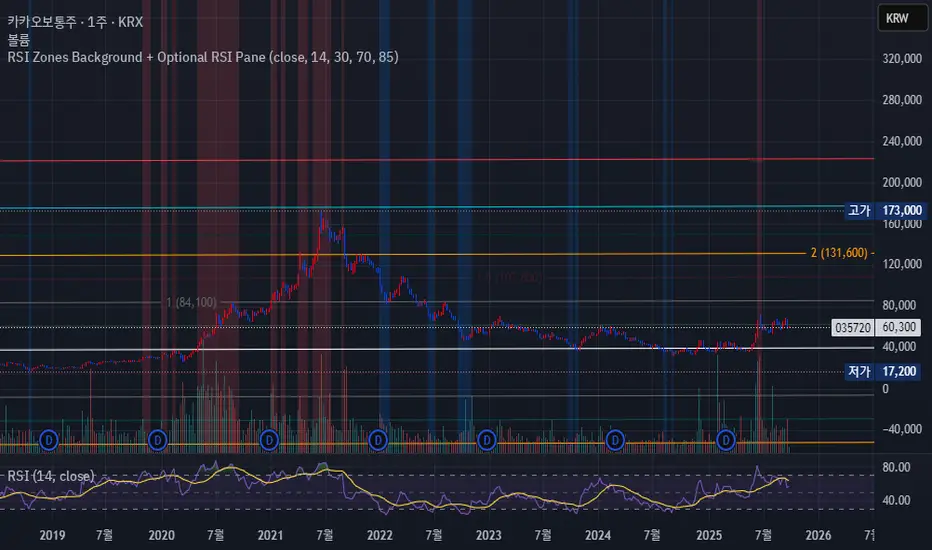
RSI Zones Background + Optional RSI PaneOverview
This Pine Script indicator does two things at once:
Colors the background of the main price chart whenever the RSI value is below a lower threshold (default 30) or above an upper threshold (default 70). This highlights oversold and overbought zones directly on the price chart itself.
Optionally displays a separate RSI panel with the RSI line and shaded region between the two threshold levels for reference.
The indicator is fully customizable through the settings panel—color choices, transparency, and whether to show the separate RSI pane can all be adjusted.
Key Parts of the Code
1. Inputs
src: The source price series for RSI calculation.
len: RSI lookback length (default 14).
lowerThr and upperThr: The lower and upper thresholds (defaults: 30 and 70).
lowColor and highColor: Colors for the background when RSI is below or above the thresholds.
bgTrans: Transparency level for the background shading.
showRSI: Boolean to toggle the optional RSI pane on or off.
2. RSI Calculation
rsi = ta.rsi(src, len)
This computes the RSI from the chosen price source.
3. Background Coloring on the Price Chart
bgCol = rsi <= lowerThr ? color.new(lowColor,bgTrans) :
rsi >= upperThr ? color.new(highColor,bgTrans) :
na
bgcolor(bgCol)
If RSI ≤ lower threshold: background turns lowColor (oversold zone).
If RSI ≥ upper threshold: background turns highColor (overbought zone).
Otherwise, no background color.
4. Optional RSI Pane
plot(showRSI ? rsi : na, display=display.pane)
Plots the RSI line in a separate pane when showRSI is true; otherwise hides it.
5. Horizontal Lines for Thresholds
hLower = hline(lowerThr, ...)
hUpper = hline(upperThr, ...)
Two horizontal lines at the lower and upper thresholds.
Because hline() can’t be wrapped inside if blocks, the script always creates them but makes them transparent (using na color) when the pane is hidden.
6. Filling Between Threshold Lines
fill(hLower, hUpper, color=showRSI ? color.new(color.gray,95) : na)
When the RSI pane is visible, the area between the two threshold lines is shaded in gray to create a “mid-zone” effect. This fill also switches off (becomes na) if the pane is hidden.
7. Alerts
The script also includes two alert conditions:
When RSI crosses below the lower threshold.
When RSI crosses above the upper threshold.
How It Works in Practice
On the price chart, you’ll see the background turn blue (or your chosen color) when RSI is ≤30, and red when RSI is ≥70.
If you enable “Show RSI” in the settings, a separate RSI pane will appear below the price chart, plotting the RSI line with two threshold lines and a shaded region in between.
You can fully adjust transparency and colors to suit your chart style.
Benefits
Quickly visualize overbought and oversold conditions without opening a separate RSI window.
Optional RSI pane provides context when needed.
Customizable colors and transparency make it easy to integrate with any chart theme.
Alerts give you automatic notifications when RSI crosses key levels.
------------------------------------------------------------------------------------------------------------------
개요
이 지표는 두 가지 기능을 동시에 수행합니다.
가격 차트 뒤 배경에 색상 표시
RSI 값이 설정한 하단 임계값(기본 30) 이하이거나 상단 임계값(기본 70) 이상일 때, 가격 차트 뒤쪽에 과매도·과매수 구간을 색으로 표시해줍니다.
선택적으로 RSI 보조창 표시
옵션을 켜면 별도의 RSI 패널이 나타나서 RSI 라인과 두 임계값(30, 70)을 연결한 구간을 음영 처리하여 보여줍니다.
설정 창에서 색상·투명도·보조창 표시 여부를 전부 조정할 수 있습니다.
코드 핵심 설명
1. 입력값
src: RSI 계산에 사용할 가격 소스(기본 종가).
len: RSI 기간(기본 14).
lowerThr / upperThr: RSI 하단·상단 임계값(기본 30, 70).
lowColor / highColor: RSI가 각각 하단 이하·상단 이상일 때 배경 색상.
bgTrans: 배경 투명도(0=불투명, 100=투명).
showRSI: RSI 보조창을 켜고 끌 수 있는 스위치.
2. RSI 계산
rsi = ta.rsi(src, len)
지정한 가격 소스를 기반으로 RSI를 계산합니다.
3. 가격 차트 배경 색칠
bgCol = rsi <= lowerThr ? color.new(lowColor,bgTrans) :
rsi >= upperThr ? color.new(highColor,bgTrans) :
na
bgcolor(bgCol)
RSI ≤ 하단 임계값 → lowColor(과매도 색)
RSI ≥ 상단 임계값 → highColor(과매수 색)
나머지 구간은 색상 없음.
4. 선택적 RSI 보조창
plot(showRSI ? rsi : na, display=display.pane)
showRSI가 켜져 있으면 RSI 라인을 보조창에 표시하고, 꺼져 있으면 숨깁니다.
5. 임계값 가로선
hLower = hline(lowerThr, ...)
hUpper = hline(upperThr, ...)
하단·상단 임계값을 가로선으로 표시합니다.
hline은 if 블록 안에서 쓸 수 없기 때문에 항상 그려지지만, 보조창이 꺼지면 색을 na로 처리해 안 보이게 합니다.
6. 임계값 사이 영역 음영 처리
fill(hLower, hUpper, color=showRSI ? color.new(color.gray,95) : na)
보조창이 켜져 있을 때만 두 가로선 사이를 회색으로 채워 “중립 구간”을 강조합니다.
7. 알림 조건
RSI가 하단 임계값을 아래로 돌파할 때 알림.
RSI가 상단 임계값을 위로 돌파할 때 알림.
실제 작동 모습
가격 차트 뒤쪽에 RSI ≤30이면 파란색, RSI ≥70이면 빨간색 배경이 나타납니다(색상은 설정에서 변경 가능).
RSI 보조창을 켜면, RSI 라인과 임계값 가로선, 그리고 그 사이 음영 영역이 함께 나타납니다.
투명도를 높이거나 낮추어 강조 정도를 조절할 수 있습니다.
장점
별도의 RSI창을 열지 않고도 가격 차트 배경만으로 과매수·과매도 상태를 직관적으로 확인 가능.
필요하면 보조창으로 RSI를 직접 확인하면서 임계값 가이드와 음영 영역을 함께 볼 수 있음.
색상·투명도를 자유롭게 조절할 수 있어 차트 스타일에 맞게 커스터마이징 가능.
RSI가 임계값을 돌파할 때 자동 알림을 받을 수 있음.
Alerte Croisement EMA9 & SMA12 (Zone remplie)📊 Moving Average 1
Period: 9 → The average is calculated over the last 9 candles (or time periods).
Shift: 0 → No shift; the average is aligned with the current data.
Method: Exponential → Uses an Exponential Moving Average (EMA), which gives more weight to recent data.
Apply to: Close → The average is based on the closing price of each candle.
📊 Moving Average 2
Period: 12 → Calculated over the last 12 periods.
Shift: 0 → No shift.
Method: Simple → Uses a Simple Moving Average (SMA), which gives equal weight to each period.
Apply to: Close → Based on closing prices.

Combined MOST + ATR MOST + ATR Combined indicator. This is published by interesting idea for my dad he tought that he combination of these two indicators gives a good result

OBV Cloud v1.0 [PriceBlance]🌐 English
OBV Cloud v1.0 – Free & Open-Source
OBV Cloud v1.0 integrates On-Balance Volume (OBV) with a Cloud model and enhanced trend filters.
It helps traders quickly identify:
Money Flow Trend: OBV Cloud acts as a dynamic support/resistance zone.
Trend Filters: EMA9 (short-term) and WMA45 (medium-term) directly applied on OBV.
OBV–Price Divergence: Detects both regular and hidden bullish/bearish divergences.
Trend Strength: Measured with ADX calculated on OBV.
OBV Cloud is suitable for both swing and day trading, allowing traders to spot breakouts, reversals, or sustained trends through volume-based analysis.

SCTI - D14SCTI - D14 Comprehensive Technical Analysis Suite
English Description
SCTI D14 is an advanced multi-component technical analysis indicator designed for professional traders and analysts. This comprehensive suite combines multiple analytical tools into a single, powerful indicator that provides deep market insights across various timeframes and methodologies.
Core Components:
1. EMA System (Exponential Moving Averages)
13 customizable EMA lines with periods ranging from 8 to 2584
Fibonacci-based periods (8, 13, 21, 34, 55, 89, 144, 233, 377, 610, 987, 1597, 2584)
Color-coded visualization for easy trend identification
Individual toggle controls for each EMA line
2. TFMA (Multi-Timeframe Moving Averages)
Cross-timeframe analysis with 3 independent EMA calculations
Real-time labels showing trend direction and price relationships
Customizable timeframes for each moving average
Percentage deviation display from current price
3. PMA (Precision Moving Average Cloud)
7-layer moving average system with customizable periods
Fill areas between moving averages for trend visualization
Support and resistance zone identification
Dynamic color-coded trend clouds
4. VWAP (Volume Weighted Average Price)
Multiple anchor points (Session, Week, Month, Quarter, Year, Earnings, Dividends, Splits)
Standard deviation bands for volatility analysis
Automatic session detection and anchoring
Statistical price level identification
5. Advanced Divergence Detector
12 technical indicators for divergence analysis (MACD, RSI, Stochastic, CCI, Williams %R, Bias, Momentum, OBV, VW-MACD, CMF, MFI, External)
Regular and hidden divergences detection
Bullish and bearish signals with visual confirmation
Customizable sensitivity and filtering options
Real-time alerts for divergence formations
6. Volume Profile & Node Analysis
Comprehensive volume distribution analysis
Point of Control (POC) identification
Value Area High/Low (VAH/VAL) calculations
Volume peaks and troughs detection
Support and resistance levels based on volume
7. Smart Money Concepts
Market structure analysis with Break of Structure (BOS) and Change of Character (CHoCH)
Internal and swing structure detection
Equal highs and lows identification
Fair Value Gaps (FVG) detection and visualization
Liquidity zones and institutional flow analysis
8. Trading Sessions
9 major trading sessions (Asia, Sydney, Tokyo, Shanghai, Hong Kong, Europe, London, New York, NYSE)
Real-time session status and countdown timers
Session volume and performance tracking
Customizable session boxes and labels
Statistical session analysis table
Key Features:
Modular Design: Enable/disable any component independently
Real-time Analysis: Live updates with market data
Multi-timeframe Support: Works across all chart timeframes
Customizable Alerts: Set alerts for any detected pattern or signal
Professional Visualization: Clean, organized display with customizable colors
Performance Optimized: Efficient code for smooth chart performance
Use Cases:
Trend Analysis: Identify market direction using multiple EMA systems
Entry/Exit Points: Use divergences and structure breaks for timing
Risk Management: Utilize volume profiles and session analysis for better positioning
Multi-timeframe Analysis: Confirm signals across different timeframes
Institutional Analysis: Track smart money flows and market structure
Perfect For:
Day traders seeking comprehensive market analysis
Swing traders needing multi-timeframe confirmation
Professional analysts requiring detailed market structure insights
Algorithmic traders looking for systematic signal generation
---
中文描述
SCTI - D14是一个先进的多组件技术分析指标,专为专业交易者和分析师设计。这个综合套件将多种分析工具整合到一个强大的指标中,在各种时间框架和方法论中提供深度市场洞察。
核心组件:
1. EMA系统(指数移动平均线)
13条可定制EMA线,周期从8到2584
基于斐波那契的周期(8, 13, 21, 34, 55, 89, 144, 233, 377, 610, 987, 1597, 2584)
颜色编码可视化,便于趋势识别
每条EMA线的独立切换控制
2. TFMA(多时间框架移动平均线)
跨时间框架分析,包含3个独立的EMA计算
实时标签显示趋势方向和价格关系
每个移动平均线的可定制时间框架
显示与当前价格的百分比偏差
3. PMA(精密移动平均云)
7层移动平均系统,周期可定制
移动平均线间填充区域用于趋势可视化
支撑阻力区域识别
动态颜色编码趋势云
4. VWAP(成交量加权平均价格)
多个锚点(交易时段、周、月、季、年、财报、分红、拆股)
标准差带用于波动性分析
自动时段检测和锚定
统计价格水平识别
5. 高级背离检测器
12个技术指标用于背离分析(MACD、RSI、随机指标、CCI、威廉姆斯%R、Bias、动量、OBV、VW-MACD、CMF、MFI、外部指标)
常规和隐藏背离检测
看涨看跌信号配视觉确认
可定制敏感度和过滤选项
背离形成的实时警报
6. 成交量分布与节点分析
全面的成交量分布分析
控制点(POC)识别
价值区域高/低点(VAH/VAL)计算
成交量峰值和低谷检测
基于成交量的支撑阻力水平
7. 聪明钱概念
市场结构分析,包括结构突破(BOS)和结构转变(CHoCH)
内部和摆动结构检测
等高等低识别
公允价值缺口(FVG)检测和可视化
流动性区域和机构资金流分析
8. 交易时区
9个主要交易时段(亚洲、悉尼、东京、上海、香港、欧洲、伦敦、纽约、纽交所)
实时时段状态和倒计时器
时段成交量和表现跟踪
可定制时段框和标签
统计时段分析表格
主要特性:
模块化设计:可独立启用/禁用任何组件
实时分析:随市场数据实时更新
多时间框架支持:适用于所有图表时间框架
可定制警报:为任何检测到的模式或信号设置警报
专业可视化:清洁、有序的显示界面,颜色可定制
性能优化:高效代码确保图表流畅运行
使用场景:
趋势分析:使用多重EMA系统识别市场方向
入场/出场点:利用背离和结构突破进行时机选择
风险管理:利用成交量分布和时段分析进行更好定位
多时间框架分析:在不同时间框架间确认信号
机构分析:跟踪聪明钱流向和市场结构
适用于:
寻求全面市场分析的日内交易者
需要多时间框架确认的摆动交易者
需要详细市场结构洞察的专业分析师
寻求系统化信号生成的算法交易者
