BTC World Price: Multi-Exchange VWAPBTC World Price: Multi-Exchange VWAP
__________________________
WHAT IT DOES
What you see above are not Bitmex candles, but this indicator's.
Bitcoin is listed on multiple exchanges. Many people have called for a single global index that would quote BTC price and volume across all exchanges: this script is such a virtual aggregate (formerly: Multi-Listed , Volume-Weighted Average Price ).
It will, independently for each tick, for any time-frame:
- Quote the price (O, H, L, C) and volume from Bitfinex (USD), Binance (USDT), bitFlyer (Yen), Bithumb (S. Korean Won), Coinbase (USD), Kraken (EUR) and even Bitmex (USD Contracts).
- Weight each price with the corresponding volume of the exchange.
- Quote the FOREX conversion rate in USD for each currency (USDJPY etc.)
- Finally return global average price (candles) in USD.
- Additionally provide (H+L)/2 etc. values.
No more "on Coinbase this" or "on Bitstamp that", you've now got a global overview!
See CoinMarketCap: Markets for reference. I've included alternative exchanges in the comments at the top of the script.
__________________________
HOW TO USE IT
Basically just add it to your chart and use the indicator's candles instead of the chart's main ticker.
By default, BTC World Price will display candles only, but you can also display OHLC & averages (in whichever style you want).
You may indeed want to hide the main symbol (top-left corner, click the 'eye' button next to its name), or switch it to something else than candles/bars (e.g. line).
Make sure "Scale Price Chart Only" is disabled if you want to use the auto-zoom feature. (if other indicators are messing your zoom, you can try to select "Line with Breaks" or "Area with Breaks" to allow these to overflow from the main window)
By clicking the triangle next to the indicator's name, you can select "Visual Order" (e.g "Bring to Front").
You can select regular Candles or Heikin-Ashi in Options.
In the Format > Inputs tab, you can select which exchanges to quote. By default, all of them are enabled.
The script also exposes the following typical values to the backend, which you can use as Price Source for other indicators: (e.g. MA, RSI, in their "Format > Input" tab)
Open Price (grey)
High Price (green)
Low Price (red)
Close Price (white)
(H + L)/2 (light blue)
(H + L + C)/3 (blue)
(O + H + L + C)/4 (purple)
They are all hidden by default (by means of maximum transparency).
In the Format > Style tab, you can change their color, transparency and style (line, area, etc), as well as uncheck Candles and Wicks to hide these.
If you are using "Indicator Last Value" and want to clear the clutter from all these values, simply uncheck them in Style. They will still be available as Price Source for other indicators.
You can also choose to scale it to the left, right (default) or "screen" (no scaling).
Once you're satisfied with your Style, you may click "Default"> "Save as default" in the botton-left. Everytime you load the indicator, it will look the same. ("Reset Settings" will reset to the script's defaults)
__________________________
Please leave feedback below in comments or pm me directly for bugs and suggestions.
Btc!

BFX:BTC Long/Short Δ [C_S] (Delta Only)This is the interior of my other script: .
The original doesnt scale well on larger time frames due to the massive amount of longs and shorts we currently have. I am also experimenting with some other methods to better scale the data. Regardless, the delta chart with candle tops is an extremely important and useful tool.

BFX:BTC Long/Short Δ & Net [C_S]Indicator displaying long/short data for BTCUSD on Bitfinex. The delta(Δ) is shown on the interior and the net is shown on the exterior. The candles and used to display the changes in the data. Total shorts are represented as a negative number even though they are a positive value.

BTC CorrelationA simple script to display how correlated the current ticker is to Bitcoin.
Inputs are the number of bars to check correlation for (default 10) and the the ticker to use for BTC comparison (default is BITFINEX:BTCUSD)
Values of 1 are highly correlated (i.e. bitcoin moves up, so does your current ticker), values of -1 are inversely correlated (i.e. bitcoin moves up, your current ticker moves down).
See: www.babypips.com for some more details on correlation

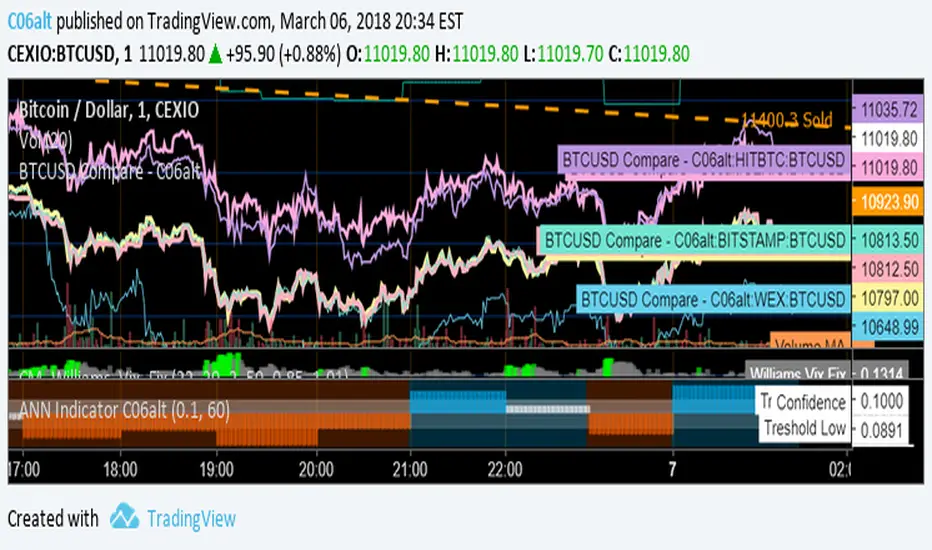
BTCUSD Compare - C06altThis Indicator allows for quick comparison between the BTCUSD exchange closing prices.
btc fractal history by @cryptoshebadds btc price history for observation of fractals in price action. default settings overlay 2013 btc bubble on 2017 btc bubble to show striking similarity between the two.

Multiple Moving AverageSuper simple script integrating three moving averages within only one script. It's going to help you to keep your chart cleaner while saving two spots for other indicators you may like. Try it out and let me know what you think.
A possible trading strategy:
Buy/Sell crossover of the MAs. Buy/Sell when fast MA crosses medium MA, double down when medium MA crosses slow MA.
Combining trading strategy is always a good idea.

VolumeBars in FiatSimple volume bars indicator for cryptocurrencies that shows their respective volume in fiat.

Crypto Ichimoku V.1Ichimoku Cloud with settings recommended for crypto by trader IAmSatoshi . Includes a handy checkbox to double inputs, and alerts that can be set for when the price crosses the bottom or top of the cloud.
This script also includes an ichimoku signal count. The signal count is an unweighted sum of positive or negative ichimoku signals with the greatest total being shown in either green(long>short) or red(short>long) or white(0, long==short). The signal count is only shown when their is a new signal or a signal is no longer valid.

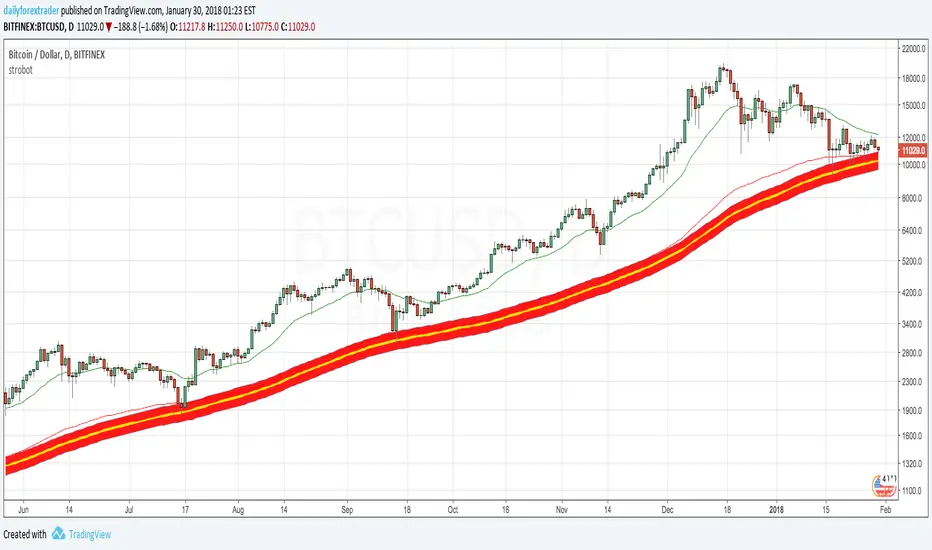
BTCUSD 1 DAY Lower band Bitcoin ScriptThis calculates the lower level of the BTC price based on the MINING vs USD.
(C)2017/18 Paul Clevett
RSI vs. BTC RSIThis script compares RSI of the underlying asset vs. BTC RSI. By comparing vs. BTC, it help inform your trades when looking for divergences.

MACD Study DASH/BTC 3H ALERTS for AutoviewAutoview qualified Study Script Alerts for Autoview
Please Set Up Alert 1x Bars Close
For Margin Trading (Poloniex)
ULTIMATE PINE INJECTOR V1.2 INSERT
MACD Created by user ChrisMoody
NO REPAINT
With Stopp Loss and Trailing Stopp and Backtest
6 Mon = 1000%

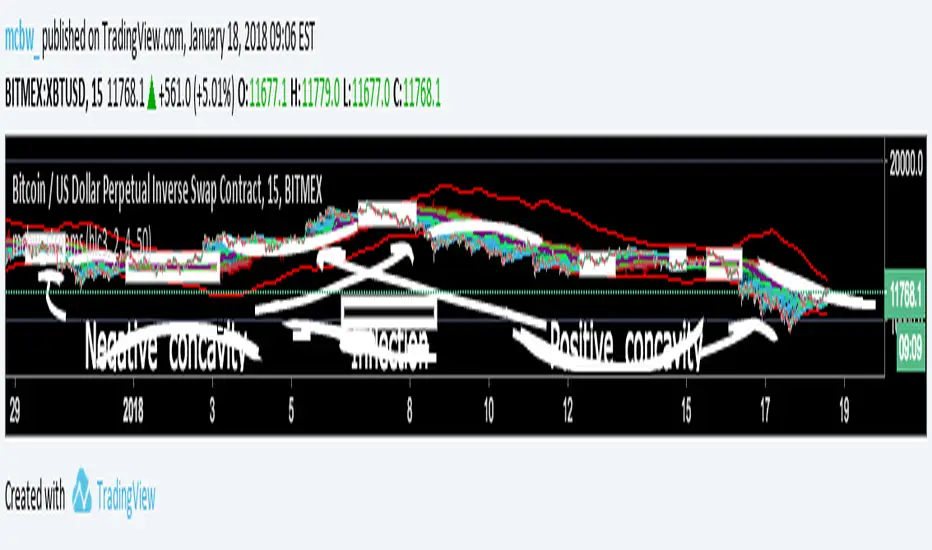
Stream Influxes and ReversalsI have a really interesting script for you guys today. While walking home I had an interesting idea that I wanted to visualize, but had no clue how it would turn out. This script is the result and it seems to provide some larger information.
For anyone who doesn't know the definition of concavity here is a super quick calculus lesson: Concavity is a fancy word for the sign of the second derivative of something. This is the SLOPE OF A SLOPE; how fast is the rate of change changing? An example is position, if you are in a place and want to go to another place the first derivative how you move there is the velocity, if you are measuring the derivative of velocity that is called acceleration. If you are speeding up then you have positive concavity. If you are slowing down you have negative concavity. On a graph positive concavity looks like a cup, negative concavity looks like an upside down bowl. Infection is just a fancy word for when it is zero, which means - to + or + to - So...
If we look at the concavity of the edges it seems to provide us clues about how the price is moving and where it wants to reverse. I made boxes around points of inflection (pos --> neg or neg --> pos concavity)
The purple lines are just moving averages of the green dots. The green dots are where the edges are at each time step, just the average of all of them at once. If price is wiggling a lot then it creates lots of edges, the green dots get plotted close to the price line, which moves up the purple lines.
The red line is a highlight of the last line, helps guide the eye.
The other smooth red lines are a shout out to bollinger bands, set the band width smaller to find break outs or squeezes.
There really isn't a defined strategy for how to use this, but with all the messages I am getting about these scripts everyone is always surprising me with what they see. So I hope some of you can make some good calls with this!
Theres lots of calculations here and it takes a long time to load, if it won't load, just toggle something back and forth till it does.
Happy trading everyone! I hope these scripts give some of you financial freedom. If you're making really good profits then share some of it with those who are less fortunate. Cheers
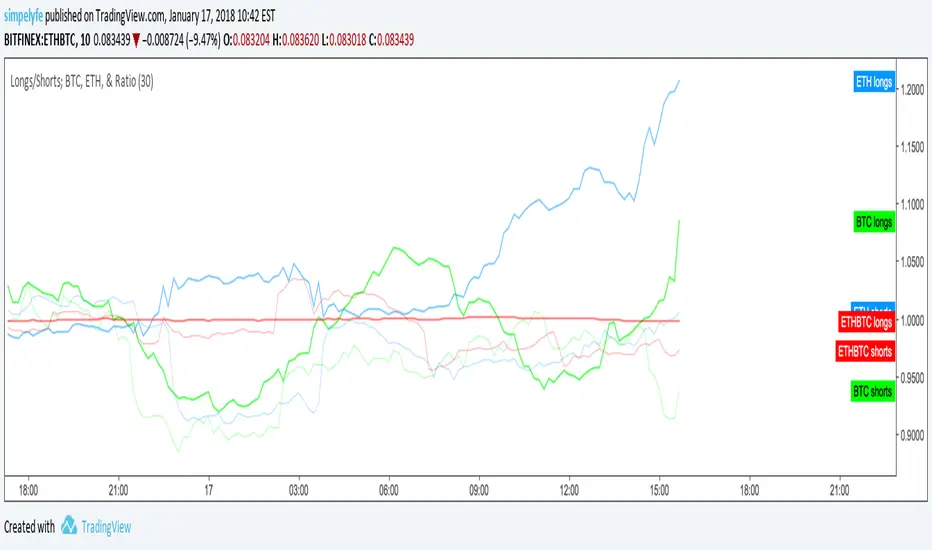
Longs vs. Shorts; BTC, ETH, & RatioLongs vs. Shorts for the following normalized as a ratio of desired period (editable).
ETHUSD
BTCUSD
ETHBTC
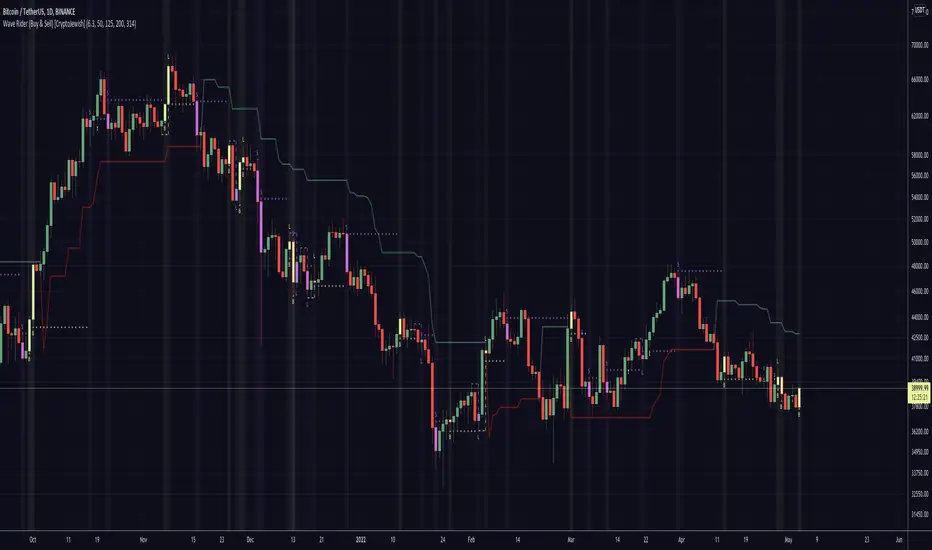
Buy + Sell [CryptoJewish]Beta
This indicator helps identify areas of buying and selling.
There are 4 levels of signals.
1. Weak
2. Medium
3. Strong
4. Extremely strong
Also there is a lagging indicator, which gives a signal of the 2nd level.
Levels greater than 1 are highlighted with a background and the color of the last bar is mixed with the color of the signal.
Almost everything can be turned on / off.
---
Additionally included:
- Ichimoku Cloud with settings for crypto (pure cloud, no extra lines)
- Bollinger Bands
- 4x SMA with a cross between them
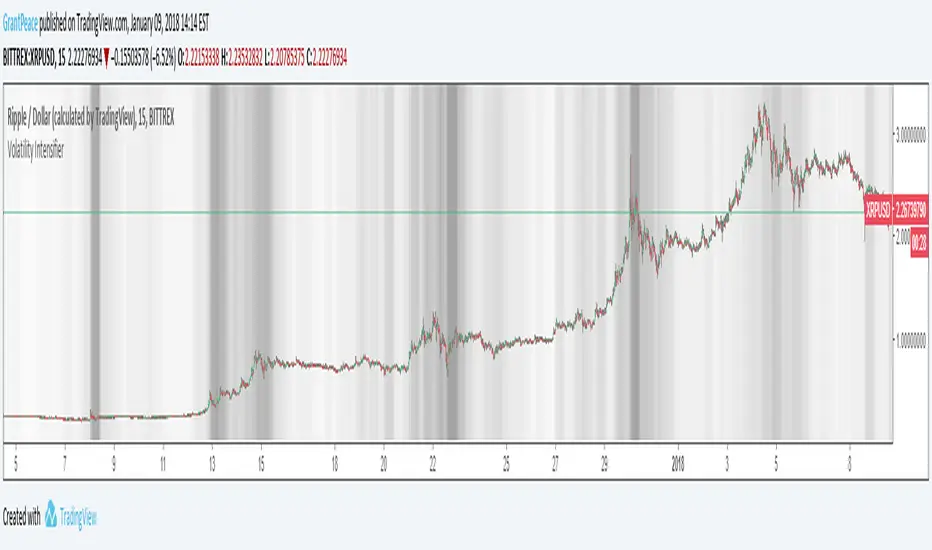
Volatility IntensifierThe background becomes increasingly dark during periods of high volatility.
...and yes, it can get completely black!
This makes it easier to identify areas that are "hot" with price action and appealing to trade.
Follow and comment to be added to the access to this indicator granted every Monday.
Like for more indicators! Thanks to all of my followers, you are the real MVP <3
To clarify; No, this indicator is based off of volatility, NOT volume :)


Raicher StrategyAnalyzes 343-minute intervals, spotting bullish/bearish trends, giving you the opportunity to strategize your trades according to market momentum.

MayerMultiple StochasticThis is an stochastic chart of Price adjusted Mayer Multiple Average Delta.
Moving Average Function can be selected from a list with standard functions and following experimental extras:
- Volume Weighted Exponential Moving Average
- Volume Weighted Time Decayed Moving Average // similar to vwema, but alpha is calculated from length as half-life decay function (not sure if I got that right...)
Default MA function is sma, to keep it true to the original MM indicator, but I think VWEMA and VWTDMA may perform better with exponential nature of Bitcoin .
See also:
Suggestions and bug reports are welcome =)
