Session High/LowSession High Low
Trading Sessions
Forex Sessions (oder Futures Sessions, je nachdem, was du handelst)
Pine Script Indicator
Intraday Levels
Market Sessions
High Low Lines
Day Trading Tools
Candlestick analysis

piPH"Signals Refined. Opportunities Defined."
piPH is built for traders who value precision over noise. By demanding multiple confirmations, it avoids the trap of chasing every move and instead focuses on high-probability setups that align with trend, momentum, and divergence.

Josh FXJoshFX Multi-Timeframe Levels & Fair Value Gap Indicator
This powerful TradingView indicator provides a comprehensive view of key market levels and trends across multiple timeframes. Designed for traders who want precise entries and market context, it includes:
Previous Daily Levels: Automatically marks the previous day’s High, Low, and 50% midpoint.
Multi-Timeframe Trend: Displays the trend direction for 5-minute, 15-minute, 1-hour, and 4-hour charts directly on your current chart.
Daily Candle Display: Shows the current daily candle for quick visual reference.
Pivot Points: Accurately marks technical highs and lows (pivot points) to the exact unit on the chart.
Fair Value Gaps (FVGs): Highlights areas of imbalance for potential high-probability trade setups.
JoshFX Telegram Watermark: Includes branding for the JoshFX community.
This all-in-one tool is perfect for traders combining price action, liquidity concepts, and multi-timeframe analysis to find high-quality setups efficiently.

LiquidityPulse RSI Candle Strength MomentumLiquidity-Pulse RSI Candle Strength Momentum is a multifunctional and original candle-analysis tool designed to highlight the potential internal strength of each candle using a combination of body size and volume.
To view the candle-strength scores clearly: right-click on the chart, go to Settings, and in the Symbol tab untick Body, Borders and Wicks.
Candle Strength Scores
The indicator calculates the average body size and average volume over a user-defined lookback period. Each candle is then compared to these averages, and the indicator combines relative body expansion and relative volume expansion with a square-root calculation to create a (normalised) candle-strength score from 1 to 10.
10 – exceptionally strong compared to the lookback average (large body size and volume)
1 – very weak compared to the lookback average (small body size and volume)
Bullish and bearish candles are evaluated independently, producing separate bull-strength and bear-strength scores.
Optional ATR and volume floors can be enabled to restrict strength scoring to candles that exceed a minimum volatility or participation threshold. This helps users who prefer to filter out low-impact candles during quiet market periods. This option can be enabled or adjusted in the settings but is turned off by default.
Candle Colours
This tool also shows candles coloured based on the candle-strength scores (10 colours in each theme), which makes it easier to visualise the scores and see whether the candle score was high or not. There are several options in the 'colour theme' dropdown menu in the settings. Users can also customise all colours manually.
RSI Candle Strength Arrows
The Relative Strength Index is a long-established momentum tool that calculates the ratio of average upward moves to average downward moves over a defined period, allowing traders to identify potential overbought and oversold market conditions where momentum may be stretched. As well as this, strong early momentum and participation are often associated with more sustained moves.
This indicator combines this methodology and provides optional arrows that appear only when candle strength and RSI conditions align:
– A candle meets or exceeds a chosen strength threshold
– RSI has recently reached an overbought or oversold level
– The candle direction matches the expected momentum shift
For example, if price has reached an oversold RSI level and a strong bullish candle forms (high candle-strength number), an upside arrow may plot.
Users can customise the RSI oversold and overbought thresholds, the minimum candle-strength threshold, and how many bars back the RSI condition must have occurred in the settings.
These arrows are not buy or sell signals but instead highlight rare moments where strong candle behaviour aligns with meaningful RSI extremes. This is useful to users because it allows the candle-strength logic to be applied only when momentum is genuinely stretched, filtering out noise and focusing attention on the most statistically significant market moves.
This indicator brings together a quantitative candle-strength model and a momentum-based RSI filter to give users a clearer view of how individual candles behave relative to their recent environment, while also highlighting when those movements occur during meaningful shifts in market momentum. By combining both forms of analysis, the tool helps traders distinguish ordinary price changes from potentially significant structural behaviour.
How traders can use this indicator
– Stronger candle scores in the trend direction can confirm continuation pressure.
– Powerful opposing candles appearing at RSI extremes may signal potential reversals or exhaustion points.
– If breakouts occur with high candle scores, price may be more likely to follow through.
– Weak candles with low scores help traders avoid false signals or low-quality setups.
– Candle-strength scoring helps users quickly interpret both volume and candle-body behaviour without manual analysis.
Open source, if anyone has any ideas on how to make the script better or have any questions please let me know :)
Disclaimer
This indicator is provided for educational and analytical purposes only and should not be interpreted as financial advice or a recommendation to buy or sell any asset. The candle-strength values displayed by this tool are not literal or definitive measures of market strength; they are derived from a custom mathematical model designed to highlight relative differences in candle behaviour. These values should be viewed as a simplified representation of candle dynamics, not as an objective or universal measure of strength.
Users should be aware that this calculation does not replace the importance of analysing real traded volume, order flow, liquidity conditions, or broader market context. As with any technical tool, results should be considered alongside other forms of analysis, and past performance does not guarantee future outcomes. Use at your own discretion and risk.

A+ Model - Cave EducationHere is a comprehensive and detailed explanation of the "A+ Model - Cave Education" Pine Script code.
This script is a sophisticated technical analysis tool designed for TradingView. It assists traders in identifying specific institutional time windows, price ranges (sessions), and "Macro" volatility periods based on the ICT (Inner Circle Trader) or similar time-based trading concepts.
Below is the breakdown of how the code functions, organized by its logic sections.
1. General Overview
The script is an overlay indicator (it sits directly on the price chart). Its primary purpose is to:
Highlight a specific trading session (The "A+ Box") and mark its High/Low.
Mark key institutional times (07:00 NY and 09:30 NY Open).
Identify "Macro" windows (specific 20-minute periods where algorithms are active) and draw dynamic ranges around them based on volatility (ATR).
Project future times onto the chart to help the trader prepare for the next day.
2. Settings & Inputs (User Configuration)
The code begins by defining a vast array of user inputs, grouped for better usability:
General Time & Box: Allows the user to define the "A+ Session" time (default 20:00-00:00) and the Time Zone (UTC-5/New York). It also handles the visual style (colors) of the session box.
Visibility: A crucial performance and visual clutter setting. boxDays limits how far back the A+ boxes and time lines are drawn (default 14 days). Macros are strictly limited to the current week to prevent chart lagging.
Line & Text Controls: Every visual element (A+ lines, NY markers, Macros) has toggles (input.bool) to show/hide the lines or the text labels separately.
Macro Settings: Defines the time windows for three separate macros and an ATR Multiplier. The ATR multiplier determines how wide the channel lines are drawn around the macro price action.
3. Logic Breakdown by Section
Section 1: The "A+ Draw" Box (Session Range)
This is the core of the A+ Model.
Logic: The script checks if the current bar is within the user-defined sessionTime.
Box Creation:
When the session starts, it initializes a new Box (box.new).
Throughout the session, it continuously updates the Box's Top (Highest High) and Bottom (Lowest Low) to encompass the full range of that time period.
Extension Lines (Support/Resistance):
Once the session ends, the script draws two horizontal lines: one from the Session High and one from the Session Low.
Smart Break Logic: These lines are active (highActive, lowActive). They extend to the right until the price breaks them (High line is broken by a higher price, Low line by a lower price). This helps traders see if the session range is being respected or broken later in the day.
Section 2: Time Lines (NY Midnight & Open)
This section marks vertical reference points.
It checks for specific times: 07:00 and 09:30 (in the user's timezone).
If the current bar matches these times, it draws a vertical line (line.new) covering the High/Low of that bar and places a label (e.g., "NY." or "09:30") above it.
This helps the trader orient themselves regarding the New York session Open and the "Killzone" start.
Section 3: Macros (Volatility Windows)
This is the most complex calculation in the script.
Definition: Macros are specific time windows (e.g., 09:50–10:10) where price delivery is often accelerated.
Visibility Rule: To keep the script fast, this only runs if isCurrentWeek is true.
ATR Offset: The script calculates the Average True Range (ATR). It uses this to create a "channel" around the price.
Drawing Logic:
When a Macro time starts, the script tracks the Highest High and Lowest Low inside that specific 20-minute window.
It draws parallel horizontal lines above and below these prices.
The Twist: The lines are not drawn at the High/Low. They are offset by ATR * Multiplier. This creates a wider "zone" around the macro price action, visually indicating a volatility range.
Section 4: Future Projection (Tomorrow)
This feature is for planning ahead.
It runs only on the last bar of the chart (barstate.islast).
It calculates the timestamps for the next occurrence of the key times (07:00, 09:30, and all three Macros).
It draws vertical lines into the future (empty space on the right of the chart).
Benefit: The trader can see exactly where 09:30 or the next Macro will occur on the timeline before the candles even print.
4. Helper Functions
The code uses custom functions to keep the logic clean:
f_drawFuture(...): A standardized function to draw the future vertical lines and labels so the code doesn't have to repeat itself for every single time marker.
isStartTime(...) & isInTime(...): Shorthand functions to check if the current candle belongs to a specific session string (like "0950-1010").
Summary of Improvements in this Version
Compared to a standard indicator, this script is highly optimized:
Text Control: You can turn off text labels while keeping the lines (or vice versa).
Performance: It limits historical drawing (only 14 days back for boxes, only this week for macros) to prevent "Maximum Line Count" errors in Pine Script.
Visual Clarity: It uses different colors for different Macros (Blue, Red, Orange) to make them instantly distinguishable.

Daily Gap Highlighter (Partial Gaps + Age Filter)Daily Gap Highlighter – 部分的な窓の未埋めエリアを自動描画
このインジケーターは、日足チャートにおける窓(ギャップ)を自動で検出し、
その後の値動きで一部だけ埋まった場合も、埋め残し部分だけを正確に描画するツールです。
🔍 主な特徴
日足ベースで窓を検出
上窓:当日の安値 > 前日の高値
下窓:当日の高値 < 前日の安値
部分的な窓埋めにも対応
例:窓の90%が埋まった → 残り10%だけ窓として残す
完全に埋まった窓は自動的に削除
窓の“鮮度フィルター”を搭載
指定した日数(デフォルト90日)を経過した古い窓は自動で非表示にできます。
トレンド転換ポイントの可視化に最適
未埋めギャップは多くのトレーダーが注目する価格帯であり、
サポート/レジスタンスとして高い機能を持ちます。
📈 活用例
スイングトレードでのターゲット設定
窓埋めの完了・未完了の判定
重要水平ラインとしての分析
長期的な価格メモリーの可視化
日足チャートを使うトレーダーの方にとって、
“本当に意味のある未埋め窓だけ”が残る実用的なインジケーターです。
🇺🇸 English Description (for TradingView Community)
Daily Gap Highlighter – Precise Partial Gap Visualization
This indicator automatically detects daily price gaps and visualizes them on the chart —
but with one powerful upgrade:
It keeps only the unfilled portion of the gap.
🔍 Key Features
Daily-based gap detection
Up Gap: Today’s Low > Previous High
Down Gap: Today’s High < Previous Low
Partial gap filling supported
Example: If 90% of the gap has been filled,
→ Only the remaining 10% is still shown as an active gap.
Fully filled gaps are automatically removed
Gap “age filter” included
Automatically hide gaps older than a chosen number of days (default: 90).
Great for identifying key market levels
Unfilled gaps often act as strong support/resistance zones
and are widely watched by professional traders.
📈 Use Cases
Setting targets for swing trades
Determining whether a gap is filled or partially filled
Highlighting significant horizontal price levels
Visualizing long-term market memory zones
This tool is ideal for traders who want
a clean and accurate view of meaningful unfilled gaps only.

God Fad Strategy"This strategy is developed for educational and testing purposes, originally conceptualized by Akash Khadse Sir from TMT Academy. Access is restricted to TMT Academy students only. The indicator monitors Market Structure Shifts following Higher Timeframe

Support Resistance📌 1. Indicator Name
Premium Auto Support & Resistance
📌 2. One-Line Description
An automated S/R system that generates support and resistance zones based on swing highs and lows, displaying them in a premium visual style directly on the chart.
📌 3. Overall Summary (7+ lines)
This indicator automatically detects price levels where the market has repeatedly reacted and generates support and resistance zones.
Instead of simple horizontal lines, it visualizes reaction ranges as zones, helping traders clearly understand the actual price areas where activity occurs.
It uses swing points (high/low pivots) as the fundamental basis and continuously updates only the most meaningful recent S/R levels.
A smoothing process is applied, reducing noise and creating more natural, reliable S/R zones.
Support and resistance are displayed as filled transparency-based zones, enabling intuitive identification of zone strength and market position.
When price touches one of these zones, a small signal appears to highlight potential reversal points.
All elements are plotted directly over the candles with overlay=true, making it an instantly usable and visually premium tool.
📌 4. Advantages (6 items)
① Automatic Swing-Based S/R Detection
Automatically analyzes key pivot points and extracts only the most meaningful support and resistance levels.
② Support/Resistance Zone Structure
Provides intuitive reaction ranges instead of single lines, making it far more practical for real trading.
③ Smooth Premium-Style Lines
S/R lines are smoothed to remove noise, maintaining a natural and refined premium visual appearance.
④ Automatic Candle-Touch Alerts
Displays signals whenever price touches support or resistance, helping you quickly identify potential reversal areas.
⑤ Overlay-Based Immediate Clarity
Drawn directly onto the chart without occupying indicator windows, keeping visual focus on price action.
⑥ Simple Yet Powerful Framework
A pivot + smoothing + zone combination that strengthens automatic S/R detection while remaining easy for beginners to use.

ICT Open Range Gap & 1st FVG + MNO/PDHL Title:
ICT Open Range Gap & 1st FVG + MNO/PDHL (Source Rays)
Description:
This is an enhanced version of the "ICT Open Range Gap & 1st FVG" indicator (originally by fadizeidan), modified to include essential daily institutional reference levels with precise "Source Ray" visualization.
This tool is designed to declutter your chart by keeping only the active day's levels visible while providing historical precision for Previous Day High/Low and Midnight Open.
Key Features:
1. MNO (New York Midnight Open)
Automatically captures the exact opening price at 00:00 New York Time.
Draws a level extending to the current price action to act as a bias filter (Bullish above/Bearish below).
Note: This strictly uses 00:00 ET, distinct from the Settlement/Electronic open.
2. PDH & PDL with Source Rays
Previous Day High (PDH) and Previous Day Low (PDL) are not just arbitrary horizontal lines.
Source Ray Logic: The lines originate from the exact timestamp/candle where the High or Low occurred yesterday. This helps you visualize the "origin" of the liquidity pool.
The lines automatically extend to the right of the current price.
3. ICT Open Range Gap & 1st FVG (Original Logic)
Retains the core functionality of measuring the gap between the 09:30 NY Open and the prior Close.
Identifies the first 1-minute Fair Value Gap (FVG) after the opening bell.
Includes quadrant projections (25%, 50% CE, 75%) for the opening range.
Settings:
Daily Levels (Source Rays): A new settings group allows you to toggle MNO, PDH, and PDL on/off individually.
Customization: Fully customizable colors, line styles, and labels for all levels.
Active Only: To maintain a clean chart, daily levels (MNO/PDH/PDL) are persistent for the current session only and do not clutter historical data.
Credits:
Original script logic by fadizeidan.
Modifications for MNO & PDHL Source Rays by Assistant.

Pure Wyckoff V50R [Region Based]Pure Wyckoff V50R — Regional Wyckoff Volume-Price Structure Scanner
This script implements a semi-automatic Wyckoff volume–price analysis based purely on regional behaviour, not on single candles. Instead of trying to label every bar, it analyses the last N candles (default ≥ 50) and their volume distribution to estimate whether the market is in an accumulation, distribution or trend phase.
Main features:
🔍 Region-based structure detection
Scans the last regLen bars to find the trading range, then attempts to locate key Wyckoff points such as
SC (Selling Climax), AR, ST, Spring, UT, LPSY, and draws the SC–AR band when a structure is active.
⚖️ Supply–demand balance
Uses regional bullish vs bearish volume to show whether Demand > Supply, Supply > Demand, or Balanced for the current range.
🧠 Phase & decision panel
For the current bar the panel summarises:
overall structure (bullish / bearish / ranging),
approximate Wyckoff phase (e.g. “A phase: SC→AR rally”, “B phase: top distribution zone”, “Bottom testing zone”),
VSA-style bar reading (no supply, effort vs result, SOW, etc.),
current key signal (Spring / UT / LPSY / ST / Trend),
one-line short-term and long-term trading bias.
📊 Scoreboard
Simple scores for structure, volume and trend to give a quick “bullish / bearish / neutral” overview.
Recommended use:
Designed mainly for higher timeframes (Daily / 4H) where Wyckoff structures are clearer.
Parameters (window length, volume averages, multipliers) should be tuned to the instrument and timeframe.
This is a structure helper, not an automatic signal provider – always combine it with your own discretion and risk management.
Disclaimer: This script is for educational and analytical purposes only and does not constitute financial advice. Use at your own risk and feel free to share feedback or improvements.

QLC v8.4 – GIBAUUM BEAST + ANTI-FAKEOUTQLC v8.4 – GIBAUUM BEAST + ANTI-FAKEOUT
QLC v8.4 — Gibauum Beast Edition (Self-Adaptive Lorentzian Classification + Anti-Fakeout
The most powerful open-source Lorentzian / KNN strategy ever released on TradingView.
Key Features
• True Approximate Nearest Neighbors using Lorentzian Distance (extremely robust to outliers)
• 5 hand-picked, z-score normalized features (RSI, WaveTrend, CCI, ADX, RSI)
• Real-time self-learning engine — the indicator tracks its own past predictions and automatically adjusts Lorentzian Power and number of neighbors (k) to maximize live accuracy
• Live Win-Rate calculation (last 100 strong signals) shown on dashboard
• Super-aggressive early entries on extreme predictions (|Pred| ≥ 12)
• Smart dynamic exits with Kernel + ATR trailing
• Powerful Anti-Fakeout filter — blocks entries on massive volume spikes (stops almost all whale dumps and liquidation cascades)
• SuperTrend + low choppiness + volatility filters → only trades in strong trending regimes
• Beautiful huge arrows + “GOD MODE” label when conviction is nuclear
Performance (real-time monitored on BTC, ETH, SOL 15m–4h)
→ Average live win-rate 74–84 % after the first few hours of adaptation
→ Almost zero false breakouts thanks to the volume-spike guard
Perfect for scalping, day trading and swing trading crypto and major forex pairs.
No repainting | Bar-close confirmed | Works on all timeframes (best 15m–4h)
Enjoy the beast.

GIX Analiza bar🔍 This indicator is called "GIX Bar Analysis" and it works simply: you add it to the chart, then click on the candle you want to analyze. After clicking, a black square appears that you can drag to move the analysis to another bar. Basically, if you want to change the analyzed bar, just drag the black square to the new desired bar.

ORB indicatorthis indicator marks out the first 15 min high and low on the candle that opens in each session, very easy to read and minimalist

FVG [Stansbooth]Fair Value Gap (FVG) Indicator
Spot Institutional Imbalances. Trade the Rebalance.
Fair Value Gaps reveal where price moved so aggressively that it left behind untraded zones—areas where smart money is likely to return.
What It Detects
Bullish FVG : Gap between Candle 1's high and Candle 3's low — expect price to retrace here for longs
Bearish FVG : Gap between Candle 1's low and Candle 3's high — watch for shorts on the pullback
Why Traders Love It
Markets hate inefficiency. When price rockets through a zone without proper auction, it creates a magnet for future price action. This indicator automatically identifies these imbalances so you can anticipate high-probability reversal and continuation zones.
Features
Auto-detection of bullish and bearish FVGs
Customizable gap visualization
Works on all timeframes and instruments
Clean, non-repainting logic
Best Used With
Order blocks, liquidity sweeps, and market structure breaks for confluence-based entries aligned with ICT and smart money concepts.
Trade where institutions trade. Let price come to you.

SPY - VPIN [VWAP] - 195min/DailyVolume Synchronized Probability of INformed Trading (VPIN) modified with VWAP and extended to be applicable to higher timeframes (195min/daily).
The buy/sell signal theoretically based on the informed decisions of smart money. For individual stocks, there is too much noise as a large fund liquidating can create false signals on the longer timeframe.
Recommend to use on SPY to follow the movement of macro-based institutional funds. A sell signal here could mean, and this "could" is doing a lot of heavy lifting, a consensus among big players of impending systematic risk, and vice versa for buy signal. Institutions could be selling for whatever reason, and they usually sell over large periods. Also remember that this doesn't include dark pool data so it is half-baked.
Signal basically showing when smart money smarts to buy during crash, or starts to sell during melt-up phase.
This is not a complete buy/sell signal, it ONLY tries to show signals from the movement of large players so no red signal does not mean there isn't systematic risk and no green signal does not mean there is systematic risk. Combine this with other indicators.
***Remember that institutions also could be retarded, and their "informed" decision might just be them acting like a retard***
Best used on SPY on 195min timeframe. Use this signal on SPY on 195min timeframe to buy/sell high beta stocks indirectly.

1 PM IST MarkerThis lightweight Pine Script indicator automatically marks 1:00 PM IST on intraday charts, regardless of the chart’s timezone. It extracts the date from each bar and generates a precise timestamp for 13:00 in the Asia/Kolkata timezone. When a bar matches this time, the script draws a vertical red line across the chart and adds a small label for easy visual reference.
The tool is useful for traders who track mid-session behavior, monitor liquidity shifts, or analyze post-lunch volatility patterns in Indian markets. It works on all intraday timeframes and require


NIFTY, SENSEX AND BANKNIFTY Options Expiry MarkerNSE Options Expiry Background Marker
Category: Date/Time Indicators
Timeframe: Daily
Markets: NSE (India) / Any Exchange
Description
Automatically highlights weekly and monthly options expiry days for NIFTY, BANKNIFTY, and SENSEX using color-coded background shading. Works across entire chart history with customizable transparency levels.
Key Features
✅ Background Highlighting - Non-intrusive color shading on expiry days
✅ Multi-Index Support - NIFTY, BANKNIFTY, and SENSEX simultaneously
✅ Weekly & Monthly Expiry - Different transparency levels for easy distinction
✅ Customizable Expiry Days - Set any weekday (Mon-Fri) as expiry day
✅ Adjustable Transparency - Separate controls for weekly and monthly expiries
✅ Full Historical Data - Works on all visible bars across years
✅ Smart Monthly Detection - Automatically identifies last occurrence in month
✅ Color Coded - Blue (NIFTY), Red (BANKNIFTY), Green (SENSEX)
Use Cases
Options trading strategy planning
Identify expiry day volatility patterns
Visual reference for monthly vs weekly cycles
Backtest strategies around expiry days
Track multiple index expiries on single chart
Technical Details
Uses India timezone (GMT+5:30) for accurate date calculations
Handles leap years automatically
Smart algorithm identifies last weekday occurrence per month
Works seamlessly on any chart timeframe (optimized for Daily)
No performance impact - simple background coloring

Binary Options v4.0This script fixes the situation of consecutive losses from single-direction trades through window logic

RG_CHARTS_TURNOVER_DAILYIn the context of the stock market, "turnover" typically refers to the stock market turnover ratio, a key indicator of market liquidity and trading activity. It measures how frequently the total value of shares traded on a market is relative to its overall size. This metric helps investors, analysts, and regulators gauge the efficiency and vibrancy of a stock exchange—higher turnover often signals a more liquid and active market where shares can be bought or sold easily without significantly impacting prices
Why It MattersLiquidity Insight: High turnover reduces the risk of price slippage during trades.
Investor Signals: Actively traded markets attract more participants; low turnover might indicate investor caution or market inefficiencies.
Economic Indicator: Rising turnover can correlate with economic growth or speculation, while declines may signal recessions.
Cross-Market Comparison: Emerging markets often have higher ratios due to fewer listed companies but intense trading, while developed markets prioritize stability.

RelativeCandlesThis is a relative simple indicator which tell when to enter and ride the trend. It is also easy to use in investment or trading. I hope people will find it useful.

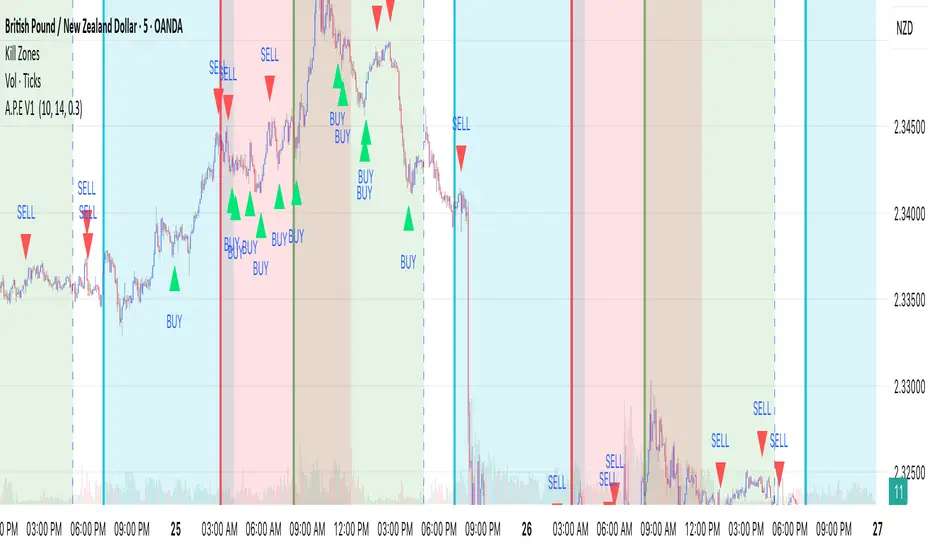
A.P.E V1
This script is a 2-candle reversal signal indicator that tries to catch sharp turns after an extreme high/low, with an optional ATR (volatility) filter. It then plots BUY/SELL triangles and can trigger alerts.
Tablero Dirección Velas – MultiTF (JorgeChutoFX)A read-only indicator that displays the candle bias (bullish, bearish, or neutral) across multiple timeframes using color-coded boxes. All timeframes are fully customizable, giving a quick visual overview of market direction.
