PopGun Detector – Trigger + 5. CandleSimple module for the popguns.
It detects PGs, marks them (trigger points), and shows the 5th candle.
This way, you don’t have to search for a long time in the chart – you can easily go through the different timeframes and specifically look for the popguns.
Candlestick analysis

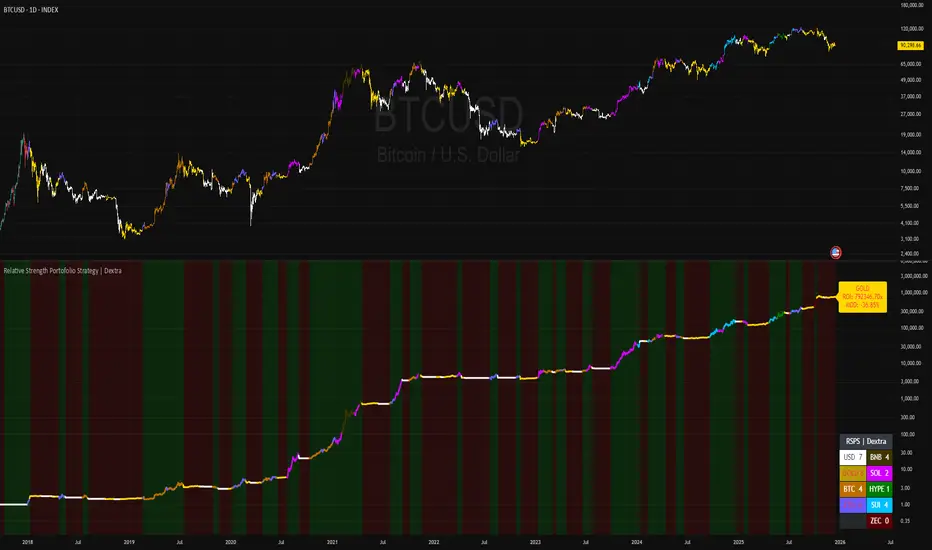
Relative Strength Portofolio Strategy (RSPS) | DextraRelative Strength Portofolio Strategy (RSPS) | Dextra
Conceptual Foundation and Strategy Innovation
RSPS is a multi-asset rotation strategy that combines pairwise relative strength analysis across major cryptocurrencies with a robust market regime filter, along with an automatic safe-haven switch to Gold or USD (cash) during weakening market conditions. The strategy is designed to dynamically allocate capital to the cryptocurrency exhibiting the strongest relative dominance during bull phases, while significantly reducing exposure when overall crypto momentum fades—aiming to capture upside from the leading sector while limiting large drawdowns.
The core approach relies on a custom momentum indicator optimized for each asset pair, incorporating hysteresis to maintain signal stability and prevent excessive rotation (whipsaw). This creates a responsive rotation system that adapts to shifts in sector strength within the crypto market, focusing on capitalizing on the strongest prevailing momentum.
Market Regime Detection
Overall market regime is determined by a custom momentum indicator applied to the CRYPTO INDEX.
Gold strength is evaluated separately via a similar indicator on the Gold asset, serving as the trigger for safe-haven allocation during bearish conditions.
Pairwise Relative Strength Analysis
Relative strength is measured through pairwise comparisons between assets using custom indicator with period and threshold parameters tailored specifically to each pair—reflecting the unique volatility and historical behavior of each relationship.
Scoring System
Each asset receives a score (0–5) based on how many other assets it “outperforms” in the pairwise comparisons.
The highest score identifies the current relative leader.
During bull markets: allocation focuses on the top-scoring cryptocurrency.
During bear markets: the system switches to GOLD (if showing strength) or USD (cash) as a defensive position.
Allocation Guidance
The script defaults to suggesting 100% allocation to the selected asset to maximize exposure to the strongest momentum. However, traders can adjust exposure percentages based on personal risk tolerance—for example, allocating 70–90% to the dominant asset and keeping the remainder in USD or stablecoins to reduce portfolio volatility.
Equity Curve & Risk Metrics
Equity curve is calculated in real-time starting from a user-defined date.
Maximum Drawdown (MDD) is tracked and displayed as the primary risk metric.
Visualization and Dashboard Features
Equity Curve: Thick line plot with dynamic coloring based on the currently active asset.
Bar and Background Coloring: Transparent green during bull regime, red during bear.
Table in the bottom-right corner: Displays real-time scores for all assets (including USD and GOLD when relevant), with asset-specific background colors and highlighting for high scores.
Information Label: Shows the current active position, total ROI (as a multiplier), and MDD (%).
Assets Covered
Major cryptocurrencies: BTC, ETH, SOL, SUI, BNB, HYPE
Safe-haven assets: GOLD, USD (cash)
It performs best on the daily (1D) timeframe, where noise is reduced and signal reliability is higher.
Summary
RSPS | Dextra provides a fully automated asset rotation framework based on pairwise relative strength with pair-specific parameters, combined with clear market regime detection and risk-off mechanics. With its comprehensive visual dashboard (score table, colored equity curve, and real-time performance metrics), the script serves as a powerful decision-support tool for navigating crypto market dynamics—capturing upside from leading sectors while protecting capital during downturns.
MM SCALP TOOLKIT v6MM SCALP TOOLKIT v6 — What This Indicator Actually Does (Explained Clearly)
The MM SCALP TOOLKIT v6 is a true Swiss-army knife for scalpers.
It combines five different tools into one clean panel, removes clutter from your chart, and automates everything that normally slows a trader down.
“MM” = Money Management
“SCALP” = Short-term precision trading
Below is the exact breakdown of what it does and why it’s valuable.
⸻
1. Automatic Risk Calculation (True Money Management)
This is the strongest feature for both beginners and experienced traders.
The problem:
In scalping, decisions must be made in seconds.
There is no time to calculate position size manually:
• Deposit: $1000
• Risk: 1%
• Stop size: X points
→ “How many units should I open?”
The solution:
The dashboard (right side) calculates the position size for you.
You set these once:
• Account balance
• Risk percentage per trade
The indicator measures current volatility (ATR) and tells you:
“Size ≈ 453 units”
The benefit:
You simply open that size, knowing a stop-loss will cost exactly 1% of your account.
This prevents over-leveraging and account blow-ups.
⸻
2. Session Filter (EU / US Only)
What it does:
It highlights active trading hours and dims the chart during low-volume periods.
Gray = dead zone (no trades)
Bright = London or New York session (good volatility)
The benefit:
You avoid low-volume chop and only take signals during real market activity.
The indicator won’t trigger entries outside your chosen sessions.
⸻
3. Liquidity Sweeps / Stop-Hunts (Smart Money Logic)
What it detects:
When price breaks a previous swing high, grabs liquidity, and then snaps back — a classic stop-hunt.
On the chart you’ll see:
“SWEEP”
The benefit:
This pattern often marks where big players accumulate positions using retail stops.
Shorting after a liquidity grab is far safer than guessing tops.
⸻
4. Trend Filter (EMA Fast / Slow)
Two EMAs act as a simple and effective directional filter.
• Fast EMA above slow → LONG ONLY
• Fast EMA below slow → SHORT ONLY
The benefit:
It prevents you from trading against momentum — the #1 reason scalpers lose money.
This is the “don’t be stupid” filter.
⸻
5. Delta Proxy (Aggression Analysis)
The indicator estimates buy vs sell aggression inside each candle (order-flow style).
Why it’s useful:
If price sweeps liquidity upward but Delta is weak or red → buyers are not supporting the move.
This confirms a potential reversal and strengthens SCALP SHORT signals.
⸻
How to use it (step-by-step):
1. Look at the dashboard:
• Trend: DOWN
• Session: ON
• Delta confirms sell pressure
• Stop-hunt detected above recent swing
2. Watch the chart:
When all conditions align, you will see:
SCALP SHORT (red triangle)
3. Check position size:
Dashboard shows:
“Size ≈ 0.52 BTC”
4. Enter the trade:
Your risk is fixed automatically — always consistent, always safe.
⸻
Summary: Why This Indicator Matters
The MM SCALP TOOLKIT v6 forces you to trade systematically, not emotionally:
✔ Only during high-volume sessions
✔ Only in the direction of trend
✔ Only after liquidity events
✔ Only when Delta confirms
✔ Only with correct position sizing
It’s not “signals for entry” —
it’s a complete risk-managed scalping framework in a single tool.


Quantum Expansion Engine MTF V15A+ = 0.0500+ (Nuclear hot - once a week setups)
A = 0.0300+ (Exceptional - premium trades)
A- = 0.0200+ (Excellent - very strong)
B+ = 0.0150+ (Good - your HOT threshold) ✅ TRADE
B = 0.0120+ (Above average)
B- = 0.0100+ (Decent)
C+ = 0.0080+ (Warm - your WARM threshold) ⚡ CONSIDER
C = 0.0060+ (Mediocre)
C- = 0.0040+ (Below average)
D = 0.0020+ (Poor - skip)
F = Below 0.0020 (Fail - dead market)

Quantum Expansion Engine MTF KOBK V15A+ = 0.0500+ (Nuclear hot - once a week setups)
A = 0.0300+ (Exceptional - premium trades)
A- = 0.0200+ (Excellent - very strong)
B+ = 0.0150+ (Good - your HOT threshold) ✅ TRADE
B = 0.0120+ (Above average)
B- = 0.0100+ (Decent)
C+ = 0.0080+ (Warm - your WARM threshold) ⚡ CONSIDER
C = 0.0060+ (Mediocre)
C- = 0.0040+ (Below average)
D = 0.0020+ (Poor - skip)
F = Below 0.0020 (Fail - dead market)
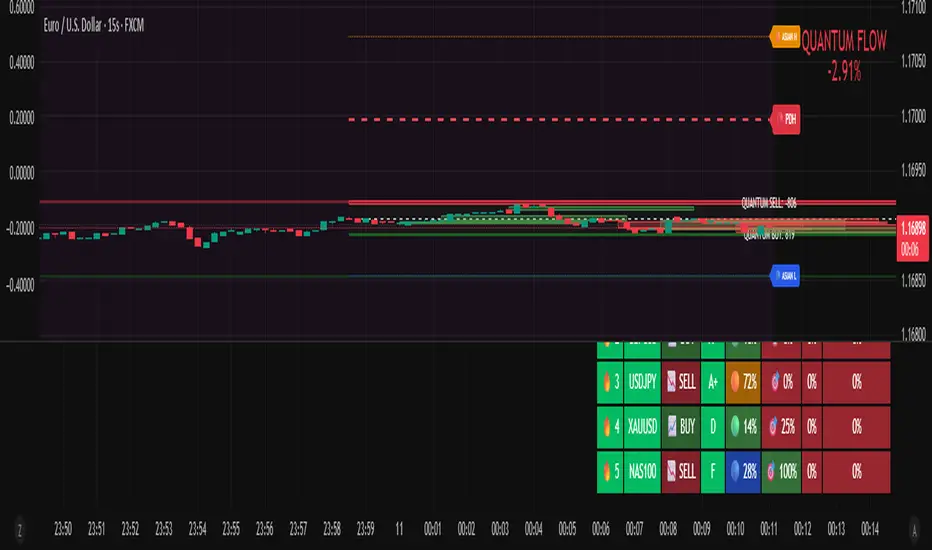
Quantum Expansion Engine MTF# 🎯 QUANTUM EXPANSION ENGINE MTF
## *Your Unfair Advantage in the Markets*
---
## 🔥 WHAT IS THIS BEAST?
Welcome to the **Quantum Expansion Engine MTF** - the most advanced multi-timeframe market scanner that separates winners from losers. This isn't just another indicator. This is your personal trading radar that scans multiple markets simultaneously and tells you EXACTLY:
✅ **WHICH** market to trade (ranked by opportunity)
✅ **WHICH** direction to trade (BUY or SELL)
✅ **WHEN** to enter (price location analysis)
✅ **WHERE** to take profit (probability-based targets)
While other traders are guessing, you'll know **with mathematical precision** where the best opportunities are hiding.
---
## 💎 WHY THIS CHANGES EVERYTHING
### **The Problem with Traditional Trading:**
- You stare at ONE chart, hoping it moves
- You have NO IDEA if better opportunities exist elsewhere
- You chase moves that already happened
- You miss the REAL winners because you weren't watching
### **The Quantum Solution:**
✨ Scans **8+ markets simultaneously** in real-time
✨ Uses **multi-timeframe analysis** (4H for direction, current TF for entry)
✨ Calculates **expansion potential** using ADR (Average Daily Range) and ATR
✨ Ranks opportunities from **BEST to WORST**
✨ Shows you **exact entry zones** with color-coded price location
✨ Gives **probability-based profit targets** so you know what's realistic
**Translation:** You'll never trade a dead market again. You'll always be on the HOTTEST movers. 🔥
---
## 🎮 THE CONTROL CENTER: YOUR SETTINGS
### **🎯 Display Filter** (Temperature Control)
Choose what opportunities you want to see:
- **"Show All"** - See everything (beginners start here)
- **"HOT Only"** 🔥 - ONLY the absolute best setups (advanced traders)
- **"WARM Only"** ⚡ - Moderate opportunities
- **"HOT + WARM"** 🔥⚡ - **RECOMMENDED** - Filters out garbage, shows quality
- **"WARM + COLD"** - Everything except hot (not recommended)
**Pro Tip:** Set to **"HOT + WARM"** and only trade what appears. This alone will 10x your win rate.
---
### **📊 Asset Type Filter** (Market Focus)
Focus on what you trade best:
- **"Show All"** - All markets
- **"Forex Only"** 💱 - Currency pairs only (EURUSD, GBPUSD, etc.)
- **"Indices Only"** 📈 - Stock indices (US30, NAS100, SPX500)
- **"Commodities Only"** 🥇 - Gold, Silver, Oil
- **"Forex + Indices"** 💱📈 - Most popular combo
- **"Forex + Commodities"** 💱🥇
- **"Indices + Commodities"** 📈🥇
**Pro Tip:** Forex traders → "Forex Only". Index traders → "Indices Only". Don't mix if you're focused.
---
### **📊 Higher Timeframe (MTF Analysis)**
Default: **240 (4-Hour)**
This is WHERE the magic happens. The engine analyzes trend direction and momentum on a HIGHER timeframe (4H or Daily), then shows you entries on your current timeframe.
**Why This Works:**
- Higher timeframe = stronger trends
- Current timeframe = precise entries
- You trade WITH the big picture, not against it
**Settings to Try:**
- **240 (4H)** - Swing traders, intraday trends
- **D (Daily)** - Position traders, major swings
- **60 (1H)** - Day traders (faster signals)
---
### **🎚️ Thresholds** (Fine-Tuning)
**🔥 HOT Threshold** (Default: 0.0015)
- Higher = stricter (fewer hot signals, higher quality)
- Lower = more generous (more hot signals)
- **Keep at 0.0015** unless you know what you're doing
**⚡ WARM Threshold** (Default: 0.0008)
- Defines the minimum "decent" opportunity
- **Keep at 0.0008** for balanced results
---
### **🎯 Take Profit Settings**
**TP1 Distance:** 250 points (conservative, high probability)
**TP2 Distance:** 500 points (moderate, balanced)
**TP3 Distance:** 1000 points (aggressive, trending markets)
**How to Use:**
- The engine shows **probability %** for each target
- Look for the **🎯 target icon** - that's your recommended exit
- **Green TP (70%+)** = High confidence, take it
- **Yellow TP (50-69%)** = Decent chance
- **Red TP (<50%)** = Low probability, avoid or scale down
**Pro Strategy:** Take 50% profit at TP1, let 50% run to TP2 or TP3. Lock in wins, let winners run.
---
## 🏆 THE QUANTUM TRADING METHOD (STEP-BY-STEP)
### **PHASE 1: SETUP** ⚙️
1. Add indicator to ANY chart (doesn't matter which - it scans all symbols)
2. Set **Display Filter** to **"HOT + WARM"**
3. Set **Asset Type Filter** to your preferred markets
4. Set **Higher Timeframe** to **240** (4H)
5. Position HUD where you like it (Bottom Right recommended)
---
### **PHASE 2: SCAN** 👀
**Every morning or before your trading session:**
1. Open the chart and check the HUD
2. Look at **RANK #1** - This is your BEST opportunity
3. Check its color:
- 🔥 **GREEN (#1)** = Prime setup, highest priority
- ⚡ **YELLOW (#1)** = Good setup, decent opportunity
- ❄️ **RED (#1)** = Market is cold, wait or skip
4. Note the **DIRECTION**: 📈 BUY or 📉 SELL
5. Check **📍LOC%** (price location in daily range)
---
### **PHASE 3: VALIDATE** ✅
**Before entering, confirm these THREE things:**
**✅ CHECK #1: Temperature + Direction Match**
- 🔥 GREEN + 📈 BUY = STRONG
- 🔥 GREEN + 📉 SELL = STRONG
- ⚡ YELLOW = DECENT
- ❄️ RED = SKIP
**✅ CHECK #2: Price Location Makes Sense**
For **📈 BUY** signals, you want:
- 🟢 0-20% = PERFECT (price at lows)
- 🔵 20-40% = GOOD (still low)
- 🟡 40-60% = OKAY (middle, less ideal)
- 🟠 60-80% = RISKY (price high)
- 🔴 80-100% = AVOID (price at highs, don't buy!)
For **📉 SELL** signals, you want:
- 🔴 80-100% = PERFECT (price at highs)
- 🟠 60-80% = GOOD (still high)
- 🟡 40-60% = OKAY (middle, less ideal)
- 🔵 20-40% = RISKY (price low)
- 🟢 0-20% = AVOID (price at lows, don't sell!)
**✅ CHECK #3: Take Profit Probability**
- Look for **GREEN TP** percentages (70%+)
- The **🎯 icon** shows recommended target
- If all TPs are red/low, market may be exhausted
---
### **PHASE 4: EXECUTE** 🎯
**The Entry:**
1. Switch to the specific market (e.g., EURUSD, NAS100)
2. Switch to YOUR entry timeframe (5M, 15M, 1H - whatever you trade)
3. Wait for a pullback/confirmation in your direction
4. Enter with proper risk management (1-2% risk per trade)
**The Stop Loss:**
Use ATR-based stops:
- **Conservative:** 1.5 x ATR below entry (BUY) or above entry (SELL)
- **Aggressive:** 1.0 x ATR
- **Or use structure:** Recent swing high/low
**The Targets:**
Follow the **🎯 recommended TP** from the HUD:
- If **TP1** is recommended → Conservative exit at 250 points
- If **TP2** is recommended → Hold for 500 points
- If **TP3** is recommended → Let it run to 1000 points
**Pro Scaling Strategy:**
- Take 33% profit at TP1
- Take 33% profit at TP2
- Let 33% run to TP3 or trailing stop
---
### **PHASE 5: MONITOR** 📊
**Throughout the day:**
- Check HUD every 1-4 hours for NEW opportunities
- If a HOTTER setup appears, consider moving capital
- The #1 spot can change as markets move
- **Alerts enabled?** You'll get notified automatically! 🔔
---
## 🚀 ADVANCED TECHNIQUES FOR DOMINANCE
### **🔥 THE "HOT ONLY" SNIPER METHOD**
**Settings:**
- Display Filter: **"HOT Only"**
- Asset Filter: Your specialty (Forex/Indices)
- Higher TF: **240** or **D**
**Strategy:**
Only trade when markets appear in the HUD. If nothing shows = NO TRADES TODAY.
**Why This Works:**
You're ONLY trading the absolute best setups. Your win rate will skyrocket because you're ultra-selective. You might only take 2-3 trades per week, but they'll be QUALITY.
---
### **⚡ THE "MULTI-MARKET" SCALPER METHOD**
**Settings:**
- Display Filter: **"HOT + WARM"**
- Asset Filter: **"Show All"**
- Higher TF: **60** (1H)
**Strategy:**
Trade the top 3 opportunities simultaneously. Diversify across markets (one forex, one index, one commodity).
**Why This Works:**
You're not putting all eggs in one basket. If NAS100 is choppy, EURUSD might be trending. Spread risk, increase opportunities.
---
### **📈 THE "SESSION HUNTER" METHOD**
**Settings:**
- Display Filter: **"HOT + WARM"**
- Asset Filter: Changes per session
- Higher TF: **240**
**Strategy:**
- **Asian Session (8PM-4AM EST):** Focus on **"Forex Only"** (JPY pairs)
- **London Session (3AM-12PM EST):** Focus on **"Forex + Indices"** (EUR, GBP, FTSE)
- **NY Session (8AM-5PM EST):** Focus on **"Indices Only"** (US30, NAS100, SPX500)
**Why This Works:**
You trade markets when they're MOST ACTIVE. Asian session = Yen. London = Euro/Pound. NY = Indices. Maximum volatility = maximum profit potential.
---
## 💰 REAL-WORLD EXAMPLE TRADE
**Scenario:** It's 9 AM EST (NY Session Opens)
**Step 1:** Check HUD
```
🔥 1 EURUSD 📈 BUY 0.5995 🟢 8% TP1: 0% TP2: 0% TP3: 0%
⚡ 2 GBPUSD 📈 BUY 0.5992 🟢 5% TP1: 85% TP2: 60% TP3: 45%
```
**Step 2:** Analyze
- **EURUSD** is HOT 🔥 but TPs are 0% (market exhausted for the day)
- **GBPUSD** is WARM ⚡ with STRONG TP probabilities
- **GBPUSD** shows 📈 BUY + 🟢 5% (price near lows) = PERFECT SETUP
**Step 3:** Execute GBPUSD Trade
- Switch to GBPUSD 15-minute chart
- Wait for bullish confirmation (break of resistance, candlestick pattern)
- Enter BUY at 1.2650
- Stop Loss: 1.2620 (30 pips, 1.5x ATR)
- Take Profit #1: 1.2675 (25 pips) ← **TP1 has 85% probability**
- Take Profit #2: 1.2700 (50 pips) ← **TP2 has 60% probability**
**Step 4:** Manage
- Price hits TP1 at 1.2675 → Take 50% profit (+25 pips)
- Move stop loss to breakeven
- Let remaining 50% run to TP2
- Price hits TP2 at 1.2700 → Take remaining profit (+50 pips)
**Result:** +37.5 pips average (25+50/2), ZERO risk after TP1, HIGH probability setup. 💰
---
## 🎯 THE GOLDEN RULES OF QUANTUM TRADING
### **RULE #1: Trust the Temperature 🌡️**
If it's 🔥 GREEN = Trade it
If it's ⚡ YELLOW = Consider it
If it's ❄️ RED = Skip it
The math doesn't lie. Cold markets stay cold. Hot markets MOVE.
---
### **RULE #2: Location, Location, Location 📍**
NEVER buy 📈 at 🔴 80%+
NEVER sell 📉 at 🟢 0-20%
Wait for price to be in the RIGHT zone or walk away.
---
### **RULE #3: Respect the Probabilities 🎲**
If TP shows 25% probability, it's a COIN FLIP.
If TP shows 75% probability, it's FAVORABLE ODDS.
Trade the odds, not emotions.
---
### **RULE #4: Higher Timeframe is BOSS 👑**
The 4H/Daily trend direction is your NORTH STAR.
Don't fight it. Trade WITH it.
---
### **RULE #5: No HUD Signal = No Trade 🚫**
If nothing appears in your filtered view, the markets are DEAD.
Cash is a position. Patience is a strategy.
---
## 🔔 ALERT SETUP (Never Miss a Setup!)
**Enable Alerts:**
1. In settings, turn ON:
- 🔥 **Enable HOT Alerts**
- ⚡ **Enable WARM Alerts** (optional)
2. In TradingView, right-click chart → **Add Alert**
3. Set **Condition:** Your indicator name
4. **Notification:** Phone, Email, SMS - your choice
5. Click **Create**
**What Happens:**
You get notified THE MOMENT a hot opportunity appears. You can be away from computer and still catch setups!
---
## 📊 BEST PRACTICES & PRO TIPS
### **⏰ BEST TIMES TO SCAN:**
- **Pre-Market:** 30 min before major sessions open
- **Session Opens:** London (3 AM EST), NY (9:30 AM EST)
- **Mid-Session:** Check every 2-4 hours
- **Avoid:** Late Friday (low liquidity), major news events (wait for dust to settle)
### **💼 RISK MANAGEMENT:**
- Never risk more than 1-2% per trade
- If #1 and #2 are both 🔥 HOT, split your risk (1% each)
- Use proper position sizing calculators
- **The engine finds setups. YOU manage risk.**
### **🧠 PSYCHOLOGY:**
- **FOMO is the enemy.** If you miss #1, there's always a #2, #3, tomorrow
- **Quality > Quantity.** 3 great trades/week beats 20 mediocre trades
- **The HUD is objective.** Your emotions are not. Trust the system.
### **📈 PERFORMANCE TRACKING:**
Keep a journal:
- What was the rank? (#1, #2, #3)
- What was the temperature? (🔥⚡❄️)
- What was price location? (🟢🔵🟡🟠🔴)
- What was TP probability?
- Did it hit target?
**After 20 trades, patterns emerge.** You'll see what works best for YOUR style.
---
## 🏆 THE COMPETITIVE EDGE
**What 99% of traders do:**
❌ Trade the same pair every day (even when dead)
❌ Guess direction based on "feeling"
❌ Have no idea where to take profit
❌ Miss better opportunities in other markets
❌ Chase moves that already happened
**What YOU now do:**
✅ Trade ONLY the hottest opportunities
✅ Follow mathematically-calculated direction
✅ Use probability-based profit targets
✅ Scan 8+ markets simultaneously
✅ Catch moves BEFORE they happen
**Result?** You're not just "trading better." You're playing a completely different game.
---
## 🚀 YOUR QUANTUM TRADING JOURNEY
**Week 1-2: LEARNING PHASE**
- Keep Display Filter on "Show All"
- Observe how markets move when they're HOT vs COLD
- Paper trade or micro lots
- Build confidence in the system
**Week 3-4: IMPLEMENTATION PHASE**
- Switch Display Filter to "HOT + WARM"
- Start taking real trades on top 1-2 opportunities
- Use conservative TP1 targets
- Track results in journal
**Month 2+: MASTERY PHASE**
- Experiment with different filters for your style
- Increase position sizes as win rate proves itself
- Use advanced multi-market strategies
- Let TP2 and TP3 targets run on high-probability setups
**Month 3+: DOMINATION PHASE**
- You're consistently profitable
- You know which setups are YOUR bread and butter
- You're capitalizing on multiple markets
- You're trading less, earning more
- **You've become the 1%** 👑
---
## 💎 FINAL WORDS
The **Quantum Expansion Engine MTF** is not magic. It's mathematics, probability, and market mechanics working in harmony.
It won't make you rich overnight.
It won't win every trade.
It won't eliminate losses.
**But it WILL:**
✅ Show you WHERE the best opportunities are
✅ Tell you WHICH direction has momentum
✅ Give you REALISTIC profit targets
✅ Keep you OUT of dead markets
✅ Stack the odds in your favor
**The difference between a losing trader and a winning trader isn't talent.**
It's **information, discipline, and execution.**
You now have the information.
The discipline and execution? That's on you.
**Welcome to the Quantum level.**
Now go dominate. 🚀🔥💰
---
## 📞 QUICK REFERENCE CARD
**🔥 HOT** = Score ≥ 0.0015 (TRADE IT)
**⚡ WARM** = Score ≥ 0.0008 (CONSIDER IT)
**❄️ COLD** = Score < 0.0008 (SKIP IT)
**📈 BUY** = Want 🟢🔵 location (low in range)
**📉 SELL** = Want 🟠🔴 location (high in range)
**🎯 TP Icons** = Follow the recommendation
**GREEN TP** = High confidence (70%+)
**YELLOW TP** = Medium confidence (50-69%)
**RED TP** = Low confidence (<50%)
**Best Settings for Beginners:**
- Display Filter: "HOT + WARM"
- Asset Filter: "Forex Only" or "Indices Only"
- Higher TF: 240
- Take TP1 always, let TP2 run sometimes
**Remember:** The market will always be there tomorrow. Only trade when the engine gives you 🔥 or ⚡. Patience pays.
---
*Built for traders who refuse to be average. 🎯*

MTF Switch Level (Single TF)Multi-timeframe Switch Level (Single TF)
This indicator marks the most recent “switch level” created by breakout / breakdown behaviour on the current timeframe.
How it works
– After a bullish breakout (close above the previous bar’s high), the script sets a bearish switch level at that previous high.
– After a bearish breakdown (close below the previous bar’s low), it sets a bullish switch level at that previous low.
– A single horizontal line extends from the latest switch level.
– The line and “S” label turn bullish when price is above the level and bearish when price is below it.
– Optional alerts fire when price crosses the active switch level.
Use-cases
– Visualise where breakout traders are likely trapped.
– Define a simple “above = bullish / below = bearish” bias line.
– Combine with higher-timeframe analysis or other tools for context.
Inputs
– Enable/disable bullish and bearish switch conditions.
– Line length, colour, style, thickness.
– Label position and offsets.
– Alert conditions for crosses.
Disclaimer
This tool is for charting and educational purposes only and is not financial advice or a signal service. Always do your own research and risk management.

Candle POC [DemaK]Indicador de puntos de control de las velas
(No es tan preciso como en las plataformas, tenemos que entender que tradingview no toma la data por tick, pero puede servir de forma orientativa)
**"Candle Point of Control Indicator
(It’s not as precise as in dedicated platforms, since TradingView does not process true tick-by-tick data, but it can still be useful as a general reference.)"**

(5+15+60min+1D)EMA20+Y'SH/L+count简介: 这是一个专为 5分钟图表 (5min Chart) 日内交易者设计的综合辅助工具。它结合了多周期趋势均线、美股核心交易时段的时间周期计数以及关键流动性位置(前一日高低点)的智能突破监测。该脚本针对美股个股及 24/7 交易的 BTC/ETH 进行了优化,强制锁定纽约时间进行运算。
核心功能:
1. 多周期 EMA 监控系统 (MTF EMAs)
5min EMA20 (蓝色):日内短期趋势核心线(默认开启)。
60min EMA20 (绿色):小时级别趋势参考(默认开启)。
15min EMA20 (红色) & 1D EMA20 (橙色):可选开启,用于捕捉更大周期的支撑阻力。
特点:所有均线采用最细线宽,平滑显示,右上角表格实时展示当前价格。
2. 美股时段 Bar Count 计数器
时间锚定:以纽约时间 (New York Time) 09:30 开盘为起点(Bar 0)。
显示规则:仅在 K 线底部显示 偶数 序号 (0, 2, 4, 6 ...),直至第 82 根 K 线停止。
关键时间窗 (Time Pivots):
Bar 18 (约 NY 10:55) 和 Bar 40 (约 NY 12:45) 会被自动高亮。
字体变为 蓝色粗体,且对应 K 线实体变为蓝色,提示潜在的变盘或宏观流动性注入时刻。
3. 智能 PDH/PDL 射线 (Smart Rays)
精确锚点:前一日高点 (PDH) 和低点 (PDL) 的射线不是从开盘画起,而是从昨日形成高低点的具体时间点射出,精确还原价格行为。
自动阻断 (Breakout Logic):一旦当前价格触碰或突破该射线,射线将自动停止延伸,直观展示“阻力/支撑已失效”。
自动清理:每日自动清除旧线,仅保留当天的参考线,保持图表整洁。
4. 视觉优化
每日分割线:自动绘制灰色虚线分隔交易日。
图表限制:脚本仅在 5分钟图表上可见,切换周期自动隐藏,避免干扰大周期分析。
设置说明:
可在设置面板中自由开关各周期 EMA 的显示。
可开关底部的计数数字显示。
English Version (for TradingView Publishing)
Title: 5min Intraday Precision Toolkit: MTF EMAs + NY Session Count + Smart Rays
Introduction: This is a comprehensive auxiliary tool designed specifically for 5-minute chart intraday traders. It combines multi-timeframe trend EMAs, time cycle counting based on the US Session, and smart breakout monitoring for key liquidity levels (Previous Day High/Low). Optimized for US Equities and Crypto (BTC/ETH) using New York Time.
Key Features:
1. Multi-Timeframe EMA System
5min EMA20 (Blue): Core short-term intraday trend (On by default).
60min EMA20 (Green): Hourly trend reference (On by default).
15min EMA20 (Red) & 1D EMA20 (Orange): Optional overlays for higher timeframe support/resistance.
Visuals: All EMAs are rendered with fine lines for a clean look, accompanied by a top-right dashboard table.
2. NY Session Bar Count
Time Anchor: Starts counting from 09:30 New York Time (Bar 0).
Display Logic: Displays only EVEN numbers (0, 2, 4...) at the bottom of the bars, stopping at count 82.
Time Pivots:
Bar 18 (~10:55 NY) and Bar 40 (~12:45 NY) are highlighted.
Labels turn Bold Blue, and the specific candles are colored Blue to indicate potential reversal or liquidity injection times.
3. Smart PDH/PDL Rays
Precise Origin: Rays for Previous Day High (PDH) and Previous Day Low (PDL) originate from the exact timestamp they were created yesterday, not just the daily open.
Breakout Stop Logic: Rays automatically stop extending once price touches or breaks them, clearly indicating that the level has been tested.
Auto-Clean: Automatically removes old rays from previous days to keep the chart clean.
4. Visual Optimization
Daily Separators: Automatic vertical dotted lines marking new days.
Visibility: All elements are hidden on non-5m charts to prevent clutter.
Settings:
Toggle visibility for individual EMAs.
Toggle visibility for the bottom bar counter.


Continuation Model by XausThis report summarizes the historical performance of the Institutional Daily Bias Probability Model on
EURUSD daily data for the 2025 calendar year. The model combines three components: 1.
Continuation bias around the previous day's high/low (PDH/PDL). 2. Reversal bias based on failed
continuation, failed breakouts, and exhaustion. 3. Neutral bias to identify liquidity-building days when no
directional trades should be taken. A fixed 25-pip stop loss (0.0025) is assumed for R-multiple
calculations. Trades are only taken when Neutral score < 50 and either Continuation or Reversal score
is at least 70, with Neutral overriding, then Reversal, then Continuation.

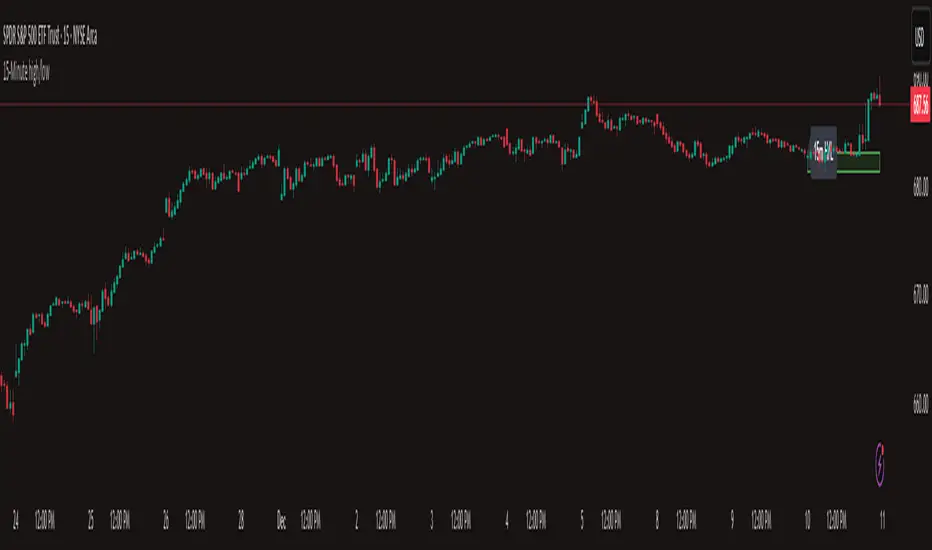
15-Minute high/lowThe 15-minute candle high/low indicator can be applied to any market during the first 15 minutes of trading.
Exhaustion IndicatorThe ScalpSQZ indicator is designed to identify four critical market states using volatility structure, momentum behavior, and exhaustion conditions. It enhances scalping precision by visually marking transitions between consolidation, squeeze conditions, and momentum reversals through color-coded candles.
1. Squeeze Conditions (Orange Candles)
Orange candles highlight volatility compression, detected when Bollinger Bands contract inside the Keltner Channels. This structure signals that market volatility is tightening and a significant expansion move is likely to follow. The squeeze represents a pre-breakout environment and serves as the earliest warning of a potential directional shift.
2. Consolidation Conditions (Yellow Candles)
Yellow candles identify phases of low directional momentum. These conditions occur when RSI remains near neutral values, MACD histogram activity is minimal, and the Rate of Change stays muted. This combination indicates that the market is balanced and non-trending, often preceding a volatility spike or a new trend. Consolidation helps traders avoid low-probability entries during indecisive price action.
3. Momentum Exhaustion — Overbought Fade (White Candles)
White candles signal potential top-side exhaustion. This occurs when RSI enters overbought territory while the MACD histogram begins to weaken compared to the previous bar. This condition does not necessarily call a reversal but warns that bullish momentum is deteriorating and upside continuation may be limited. It is particularly useful for identifying trend fatigue and tightening stop-loss placement.
4. Momentum Exhaustion — Oversold Fade (Purple Candles)
Purple candles identify bottom-side exhaustion and appear when RSI reaches oversold levels, MACD momentum begins improving, and the current close shows buyer defense relative to the previous low. This condition suggests selling pressure is diminishing and a potential reversal or relief bounce may be forming. Purple candles serve as an early indication of bearish trend exhaustion.
Color Priority System
The indicator follows a fixed hierarchy to ensure clarity:
Squeeze (orange) has the highest priority, followed by consolidation (yellow). Exhaustion signals (white for tops, purple for bottoms) apply only when no squeeze or consolidation conditions are active. This structure ensures that the most critical market states are always highlighted first.
Purpose and Application
ScalpSQZ helps traders identify optimal environments for breakouts, anticipate trend exhaustion, and avoid low-quality trades during choppy or low-momentum conditions. It is suitable for scalping, day trading, and swing trading across any asset class or timeframe.

Weekly Range Bias Panel — Ace v1.6 (1st Target)Perfect, we’ll keep the script exactly as it is and just make the “user manual” super simple.
---
## 1. What this script does (one sentence)
It tells you **what kind of week we just had** (TIGHT / NORMAL / WIDE),
marks **Last Week’s High/Low + CE**,
and gives you a **simple first target idea** for this week.
---
## 2. What each panel row means
### Row 0 – Title
`WEEKLY RANGE BIAS`
> Just the header.
---
### Row 1 – “Last Week: TIGHT / NORMAL / WIDE”
It compares **last week’s range** to the **average range of the last X weeks**.
* **TIGHT**
* Last week’s range was **smaller than usual**.
* Market is “coiled”.
* Expect **expansion** – a raid of LWH or LWL is more likely.
* **WIDE**
* Last week’s range was **bigger than usual**.
* Market already “spent a lot of energy”.
* Expect **cooling / consolidation / controlled continuation**.
* **NORMAL**
* Range was about average.
* Nothing special – treat it as a standard week.
---
### Row 2 – Hunt/Build + “1st tgt”
Example text:
`HUNT (expect a raid of LWH/LWL) | 1st tgt: LWH first`
* **HUNT** (when TIGHT)
* Look for **a raid of one side of the weekly range**.
* Script tells you which side is more likely **first**:
* `1st tgt: LWH first` → bias towards **taking out last week’s high** first.
* `1st tgt: LWL first` → bias towards **taking out last week’s low** first.
* **BUILD/COOL** (when WIDE)
* Last week was huge.
* `1st tgt: CE / mean reversion` → expect price to **respect or return to CE** more, instead of running to new extremes right away.
* **NEUTRAL** (when NORMAL)
* No special edge from range size.
* Use levels mainly as **reference / targets**, not as a strong bias.
---
### Row 3 – Range numbers
Example:
`LW Range: 480.00 | Avg(6): 520.00`
* **LW Range** = last week’s high – low (in points).
* **Avg(6)** = average range of the **last 6 weeks** (you set this with `lookback`).
You don’t need to overthink this. It’s just to **see the size** quickly.
---
### Row 4 – Price vs Weekly CE
Example:
`Above Weekly CE (premium of last week)`
* **Above Weekly CE**
* Price is trading in **premium** vs last week’s middle.
* For shorts, you want **sweeps / setups above CE**.
* **Below Weekly CE**
* Price is in **discount** vs last week’s middle.
* For longs, you want **sweeps / setups below CE**.
* **At Weekly CE**
* Market is sitting near the middle of last week’s range = **no big edge** from location alone.
---
### Row 5 – Exact levels
Example:
`LWH: 25850.00 | LWL: 25200.00 | CE: 25525.00`
* Exact prices for:
* **LWH** – Last Week’s High
* **LWL** – Last Week’s Low
* **CE** – middle of that range
You can use these as **targets, alerts, and liquidity pools.**
---
## 3. The lines on the chart
If `Plot LWH / LWL / Weekly CE` is ON:
* **Grey line** at **LWH**
* **Grey line** at **LWL**
* **Brown line** at **Weekly CE**
They extend to the right, so **this whole week** you see:
* Where last week’s extremes are.
* Where last week’s mid (CE) is.
You can use them on **any timeframe** (Daily, 1H, 15M, 5M, etc).
They are always based on **weekly data**.
---
## 4. Simple trading use-case (your style)
### Step 1 – Weekly bias (Sunday night / Monday)
Look at **Row 1–2**:
* **If TIGHT + HUNT + “1st tgt: LWH first”**
* Expect **weekly expansion up**.
* Intraday you’ll watch for **longs** that aim for **LWH** as first big target.
* **If TIGHT + “1st tgt: LWL first”**
* Same idea but **down** → look for shorts towards **LWL**.
* **If WIDE + “1st tgt: CE / mean reversion”**
* Favor **mean reversion** plays:
* If above CE → bias to **shorts back to CE** (with proper intraday confirmation).
* If below CE → bias to **longs back to CE**.
* **If NORMAL**
* No special push from weekly range.
* Use LWH/LWL as **big liquidity targets**, but let your Purge/MMXM model be the main driver.
---
### Step 2 – Intraday execution (Purge / MMXM)
Use the weekly info as **context**, not a signal:
* Treat **LWH/LWL** as **big liquidity pools**.
* Treat **Weekly CE** as **mean point / magnet**.
Example combo:
1. Script says:
* `Last Week: TIGHT`
* `HUNT (expect a raid) | 1st tgt: LWH first`
2. Price is **below CE**, building a base.
3. In your killzone, you see:
* **Sweep of intraday low**,
* **Shift in structure up**,
* Return to a 15M/5M OB/FVG.
→ You now have **HTF reason to believe upside expansion is likely**,
and your **intraday trigger** tells you where to enter.
---
## 5. Alerts (optional, but powerful)
The script already has:
* `Weekly Range = TIGHT` → tells you a **coil week** just closed.
* `Weekly Range = WIDE` → tells you a **big expansion week** just closed.
* `Raid LWH` → price traded above last week’s high.
* `Raid LWL` → price traded below last week’s low.
You can set these as **heads up alerts** on Sunday / Monday so you don’t miss the context shift.
---
If you want, next step we can add a **tiny “GO / WAIT / NO-GO” line** to the panel based on:
* TIGHT vs WIDE
* your position vs CE
* and whether LWH/LWL has already been raided this week.

Smart Scalper V7 [Churn Filter]Indicator uses relative volume by time as well as ADX to highlight if volume is high to prevent trading in chop or being faked out.
Dec 1
Release Notes
How to Read the "Traffic Light" 🚦
You asked: "How do I work out if volume is higher or lower?" Look at the White Horizontal Line running across the indicator.
Height (Quantity):
Above the Line: Volume is High (The crowd is here).
Below the Line: Volume is Low (Everyone is at lunch).
Color (Quality):
🟢 Green: High Volume + Strong Trend. (Best for Entries).
🟡 Yellow: High Volume but NO Trend. This is usually a Reversal or a Trap. (Big fight, no winner yet).
🟠 Orange: Trending, but on Low Volume. The price is drifting. Don't trust it—it can snap back easily.
🔴 Red: Low Volume, No Trend. The "Kill Zone." Do not trade.

Fair Value Gap Signals [Kodexius]Fair Value Gap Signals is an advanced market structure tool that automatically detects and tracks Fair Value Gaps (FVGs), evaluates the quality of each gap, and highlights high value reaction zones with visual metrics and signal markers.
The script is designed for traders who focus on liquidity concepts, order flow and mean reversion. It goes beyond basic FVG plotting by continuously monitoring how price interacts with each gap and by quantifying three key aspects of each zone:
-Entry velocity inside the gap
-Volume absorption during tests
-Structural integrity and depth of penetration
The result is a dynamic, information rich visualization of which gaps are being respected, which are being absorbed, and where potential reversals or continuations are most likely to occur.
All visual elements are configurable, including the maximum number of visible gaps per direction, mitigation method (close or wick) and an ATR based filter to ignore insignificant gaps in low volatility environments.
🔹 Features
🔸 Automated Fair Value Gap Detection
The script detects both bullish and bearish FVGs based on classic three candle logic:
Bullish FVG: current low is strictly above the high from two bars ago
Bearish FVG: current high is strictly below the low from two bars ago
🔸 ATR Based Gap Filter
To avoid clutter and low quality signals, the script can ignore very small gaps using an ATR based filter.
🔸Per Gap State Machine and Lifecycle
Each gap is tracked with an internal status:
Fresh: gap has just formed and has not been tested
Testing: price is currently trading inside the gap
Tested: gap was tested and left, waiting for a potential new test
Rejected: price entered the gap and then rejected away from it
Filled: gap is considered fully mitigated and no longer active
This state machine allows the script to distinguish between simple touches, multiple tests and meaningful reversals, and to trigger different alerts accordingly.
🔸 Visual Ranking of Gaps by Metrics
For each active gap, three additional horizontal rank bars are drawn on top of the gap area:
Rank 1 (Vel): maximum entry velocity inside the gap
Rank 2 (Vol): relative test volume compared to average volume
Rank 3 (Dpt): remaining safety of the gap based on maximum penetration depth
These rank bars extend horizontally from the creation bar, and their length is a visual score between 0 and 1, scaled to the age of the gap. Longer bars represent stronger or more favorable conditions.
🔸Signals and Rejection Markers
When a gap shows signs of rejection (price enters the gap and then closes away from it with sufficient activity), the script can print a signal label at the reaction point. These markers summarize the internal metrics of the gap using a tooltip:
-Velocity percentage
-Volume percentage
-Safety score
-Number of tests
🔸 Flexible Mitigation Logic (Close or Wick)
You can choose how mitigation is defined via the Mitigation Method input:
Close: the gap is considered filled only when the closing price crosses the gap boundary
Wick: a full fill is detected as soon as any wick crosses the gap boundary
🔸 Alert Conditions
-New FVG formed
-Price entering a gap (testing)
-Gap fully filled and invalidated
-Rejection signal generated
🔹Calculations
This section summarizes the main calculations used under the hood. Only the core logic is covered.
1. ATR Filter and Gap Size
The script uses a configurable ATR length to filter out small gaps. First the ATR is computed:
float atrVal = ta.atr(atrLength)
Gap size for both directions is then measured:
float gapSizeBull = low - high
float gapSizeBear = low - high
If useAtrFilter is enabled, gaps smaller than atrVal are ignored. This ties the minimum gap size to the current volatility regime.
2. Fair Value Gap Detection
The basic FVG conditions use a three bar structure:
bool fvgBull = low > high
bool fvgBear = high < low
For bullish gaps the script stores:
-top as low of the current bar
-bottom as high
For bearish gaps:
-top as high of the current bar
-bottom as low
This defines the price range that is considered the imbalance area.
3. Depth and Safety Score
Depth measures how far price has penetrated into the gap since its creation. For each bar, the script computes a currentDepth and updates the maximum depth:
float currentDepth = 0.0
if g.isBullish
if l < g.top
currentDepth := g.top - l
else
if h > g.bottom
currentDepth := h - g.bottom
if currentDepth > g.maxDepth
g.maxDepth := currentDepth
The safety score expresses how much of the gap remains intact:
float depthRatio = g.maxDepth / gapSize
float safetyScore = math.max(0.0, 1.0 - depthRatio)
safetyScore near 1: gap is mostly untouched
safetyScore near 0: gap is mostly or fully filled
4. Velocity Metric
Velocity captures how aggressively price moves inside the gap. It is based on the body to range ratio of each bar that trades within the gap and rewards bars that move in the same direction as the gap:
float barRange = h - l
float bodyRatio = math.abs(close - open) / barRange
float directionBonus = 0.0
if g.isBullish and close > open
directionBonus := 0.2
else if not g.isBullish and close < open
directionBonus := 0.2
float currentVelocity = math.min(bodyRatio + directionBonus, 1.0)
The gap keeps track of the strongest observed value:
if currentVelocity > g.maxVelocity
g.maxVelocity := currentVelocity
This maximum is later used as velScore when building the velocity rank bar.
5. Volume Accumulation and Volume Score
While price is trading inside a gap, the script accumulates the traded volume:
if isInside
g.testVolume += volume
It also keeps track of the number of tests and the volume at the start of the first test:
if g.status == "Fresh"
g.status := "Testing"
g.testCount := 1
g.testStartVolume := volume
An average volume is computed using a 20 period SMA:
float volAvg = ta.sma(volume, 20)
The expected volume is approximated as:
float expectedVol = volAvg * math.max(1, (bar_index - g.index) / 2)
The volume score is then:
float volScore = math.min(g.testVolume / expectedVol, 1.0)
This produces a normalized 0 to 1 metric that shows whether the gap has attracted more or less volume than expected over its lifetime.
6. Rank Bar Scaling
All three scores are projected visually along the time axis as horizontal bars. The script uses the age of the gap in bars as the maximum width:
float maxWidth = math.max(bar_index - g.index, 1)
Then each metric is mapped to a bar length:
int len1 = int(math.max(1, maxWidth * velScore))
g.rankBox1.set_right(g.index + len1)
int len2 = int(math.max(1, maxWidth * volScore))
g.rankBox2.set_right(g.index + len2)
int len3 = int(math.max(1, maxWidth * safetyScore))
g.rankBox3.set_right(g.index + len3)
This creates an intuitive visual representation where stronger metrics produce longer rank bars, making it easy to quickly compare the relative quality of multiple FVGs on the chart.

Linechart + Wicks - by SupersonicFXThis is a simple indicator that shows the highs and lows (wicks) on the linechart.
You can vary the colors.
Nothing more to say.
Hope some of you find it useful.

HTF LiquidityThe ICT Liquidity Sweeps Indicator is designed to track liquidity zones in the market areas where stop-losses and pending orders are typically clustered. This indicator marks buyside liquidity (resistance) and sellside liquidity (support) from HTF (H4, H1 and M15), helping traders identify areas where price is likely to manipulate liquidity before making a significant move.
This tool is based on Inner Circle Trader (ICT) Smart Money Concepts, which emphasize how institutional traders, or “Smart Money,” manipulate liquidity to fuel price movements. By identifying these zones, traders can anticipate liquidity sweeps and position themselves accordingly.
⚙️ How It Works
1️⃣ Detects Key Liquidity Zones
The script automatically identifies significant swing highs and swing lows in price action using a pivot-based method.
A swing high (buyside liquidity) is a peak where price struggles to break higher, forming a resistance level.
A swing low (sellside liquidity) is a valley where price struggles to go lower, creating a support level.
These liquidity points are prime targets for liquidity sweeps before a true trend direction is confirmed.
2️⃣ Draws Liquidity Lines
Once a swing high or low is identified, a horizontal line is drawn at that level.
The lines extend to the right, serving as future liquidity targets until they are broken.
The indicator allows customization in terms of color, line width, and maximum number of liquidity lines displayed at once.
3️⃣ Handles Liquidity Sweeps
When price breaks a liquidity level, the indicator reacts based on the chosen action setting:
Dotted/Dashed: The line remains visible but changes style to indicate a sweep.
Delete: The line is completely removed once price has interacted with it.
This feature ensures that traders can easily spot where liquidity has been taken and determine whether a reversal or continuation is likely.
4️⃣ Prevents Chart Clutter
To maintain a clean chart, the script limits the number of liquidity lines displayed at any given time.
When new liquidity zones are formed, the oldest lines are automatically removed, keeping the focus on the most relevant liquidity zones.

DeM Trend Bias Strength with Alerts (RB Trading)This tool is built to help users understand trend direction, exhaustion, and momentum shifts on the daily timeframe. It highlights when a market is transitioning from weakness to strength or strength to weakness by displaying color-coded bias bars. The script does not forecast future outcomes and should be used as an analytical aid.
Intended Usage
• Timeframe: Daily
• Instruments: Works on most FX pairs and liquid markets
• Style: Trend and bias evaluation
• Purpose: Identify early signs of momentum recovery within ongoing trends
How It Works
Bias Rotation Engine
The script measures directional pressure and smooths it into a bar display that changes color as conditions shift.
• Green bars show rising strength conditions
• Red bars show declining strength conditions
• Transitional periods often appear near market turning points and consolidation zones
This helps users visually separate healthy directional trends from weakening phases.
Trend Alignment Filter
The bars are designed to be interpreted alongside moving averages or broader trend tools. When the bars turn higher while price respects an upward structure, it often supports continuation themes. When the bars weaken during downward phases, it highlights potential areas where the trend retains control.
Identifying Exhaustion and Recovery
Repeated cycles in the bar display can highlight areas where:
• Downside pressure is fading before an upswing
• Upside pressure is fading before a pullback
• Consolidation is forming before a breakout
These transitions tend to align with moments shown in the image where the arrows mark bias shifts occurring before price acceleration.
How to Use It
• Wait for a clear color rotation before making any decisions
• Confirm with the daily trend and price structure
• Avoid using the tool by itself for entries
• Combine with support and resistance, moving averages, and candle structure
• Not intended for scalping or intraday signals
Why Daily Chart Works Best
The daily timeframe smooths out noise and gives the strength bars enough data to reveal genuine trend transitions. Higher timeframes also reduce false rotations that are common in lower timeframes.
Notes
The script does not predict or guarantee price movement. It processes historical inputs to help the user understand directional conditions. Each trader should apply their own risk plan and confirm levels before acting on any idea.

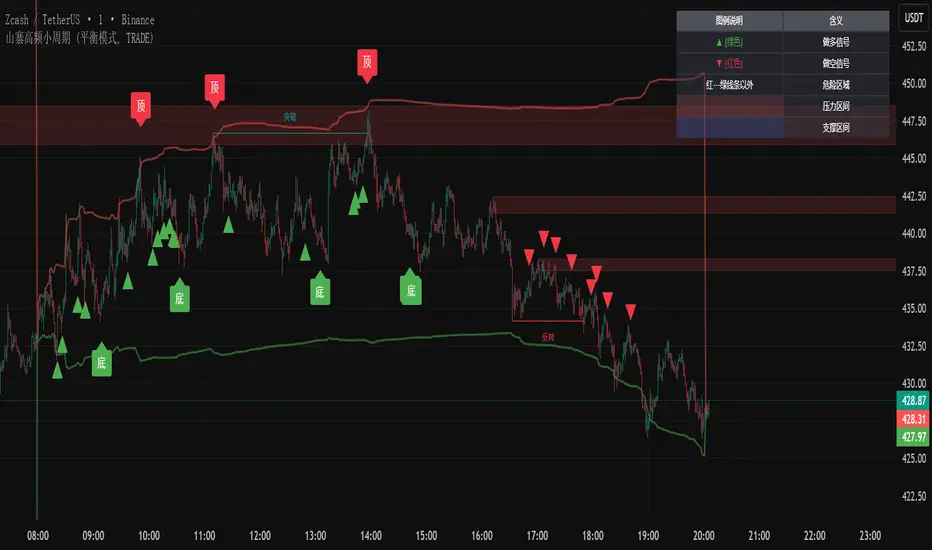
Altcoin HFT System [Beta]Core Logic: This indicator combines SMC order blocks with trend algorithms to capture high-frequency reversal points.
Features:
Auto Trend Identification (Triangle Signals)
High-Frequency Top/Bottom Detection
No repainting in confirmed mode
Usage:
Green ▲ / LONG: Potential Buy Zone
Red ▼ / SHORT: Potential Sell Zone
Note: This is a public beta version. For detailed tutorials or updates, please check the YouTube link in my profile signature.
Bob's Strategy Pro (Dynamic SL & TP)This code is for a technical analysis indicator called "SSL Strategy Pro (Dynamic SL & TP)". Its primary benefit is to provide traders with a comprehensive, all-in-one visual framework for market analysis and trade management directly on their charts.
Here are its key benefits:
For Market Analysis and Trend Identification:
It offers a clear, visual representation of market structure and the prevailing trend direction using intuitive colored bands.
A major long-term trend line helps you align your trades with the broader market direction, reducing the likelihood of trading against a strong trend.
For Trade Entry and Exit (Risk Management):
It provides specific visual entry signals, helping to identify potential trade initiation points with greater objectivity.
Its most significant advantage is a complete, built-in risk management system.
Dynamic Stop-Loss: It automatically calculates and visually plots a protective stop-loss that adapts to current market volatility. This helps protect profits during favorable moves and defines your initial risk per trade.
Multi-Tier Profit-Taking Framework: It visually plots up to four distinct profit target levels on the chart. These are calculated based on a customizable risk-to-reward ratio relative to your initial stop-loss, allowing you to plan partial profit-taking and manage trades in stages.
Progressive Target Display: To keep the chart uncluttered, the higher profit targets only appear on the chart once certain conditions are met, focusing your attention on the most relevant immediate levels.
Overall Practical Use:
Visual Clarity: By plotting all critical information (trend, signals, stop-loss, multiple targets) directly on the price chart, it consolidates analysis and planning into one view, reducing the need to switch between different tools.
Enhanced Discipline: It encourages systematic trading by pre-defining exit points for both loss protection and profit-taking before entering a trade.
Customizability: Users can adjust key parameters, such as the sensitivity of the trend channels and the aggressiveness of the stop-loss, to match different trading styles and market conditions.
In summary, this tool is designed to assist traders by visually clarifying trends, generating entry alerts, and—most importantly—integrating a dynamic and structured approach to stop-loss and take-profit management to help control risk and systematically capture profits.

Impulse TP/SL ZonesDescription (paste this):
Impulse TP/SL Zones (Spread Aware) is an invite-only trade management and execution helper, not a standalone signal generator.
The script combines:
A simple SMA trend filter to define LONG/SHORT bias.
A recent impulse range (highest high – lowest low over N bars) to size TP and SL dynamically.
Spread-aware TP/SL levels so targets reflect realistic broker conditions.
Visual blocks and lines marking risk and reward zones (Entry→TP1, TP1→TP3, Entry→SL).
A compact TP/SL table that shows all levels and adds checkmarks when TP1/TP2/TP3 are hit.
How it works (logic):
Trend direction is defined by a user-selected SMA length.
Close above SMA → LONG bias.
Close below SMA → SHORT bias.
The script measures the impulse range over the last lenImpulse bars and uses fixed fractions of that range (0.382 / 0.618 / 0.786) to build TP1/TP2/TP3.
SL is placed using impulseRange * levelRatio in the opposite direction of the bias.
A spread input (spreadPts) shifts all TP/SL levels so they more closely match actual fills.
A new “signal block” is created when the bias flips or when TP3 or SL is reached. Each block has:
Entry line, TP1/TP2/TP3 lines, SL line.
Blocks for the risk zone (Entry→SL) and profit zones (Entry→TP1 and TP1→TP3).
The script tracks when each TP is touched (by high/low depending on bias) and shows ✅ for those levels in the table.
Inputs (user parameters):
Impulse Length (lenImpulse) – bars used for the high/low impulse range.
SMA Length (smaLen) – period of the SMA trend filter.
SL/TP Multiplier (levelRatio) – how far SL is from entry relative to the impulse.
Spread (spreadPts) – spread in points for more realistic TP/SL placement.
Why invite-only / closed-source:
This script is part of a structured, proprietary trade management framework. It is not just a mashup of public indicators; the way it defines impulses, handles signal expiration, and dynamically extends zones is specific to my personal methodology. Keeping it closed-source protects the exact implementation, while this description still explains clearly what the script does and how to use it.
How to use:
Apply it to any symbol/timeframe and tune inputs to your style (scalping vs swing).
Use your own strategy to decide entries.
Use this indicator to visualize where TP1/TP2/TP3 and SL sit relative to the recent impulse and spread, and to manage partial exits and risk.
This tool does not guarantee profits or prevent losses. Always backtest and forward-test on demo before using it live; all trading decisions remain your own responsibility.
