[TTI] Jon Tr3ndy ATR Label📜 ––––HISTORY & CREDITS––––
The Jon Tr3ndy ATR Label is another creation inspired by Tr3ndy Jon (Jonathan McKeever,) and his Supply and Demand System. Building on the legacy of our premium scripts Tr3ndy Bands, Tr3ndy Edges, Tr3ndy LIS and the Tr3ndy PMZ, this script brings the power of the Average True Range (ATR) to your fingertips, but with a Tr3ndy twist.
🦄 ––––CALCULATIONS––––
The indicator uses different calculations methods to determine (Average True Range) ATR for the stock. The available calculation are:
👉 Exponential Moving Average EMA,
👉 Simple Moving Average SMA,
👉 Relative Moving Average RMA,
👉 Weighted Moving Average WMA.
The available timeframes are:
👉 Daily D
👉 Weekly W
👉 Monthly M
When you hoover with the mouse above the label, you will see what type of calculation you have chosen.
🎯 ––––WHAT IT DOES––––
The Jon Tr3ndy ATR Label is designed to dynamically calculate and display the Average True Range (ATR) of the asset directly on your chart for any of the chosen timeframes (e.g. show Weekly ATR on a Daily chart).
It can be used on equities, forex, crypto and many more. ATR is a volatility indicator that measures the degree of price volatility. This script allows users to select between daily, weekly, or monthly ATR calculations and offers a choice of four averaging methods: EMA, SMA, RMA, and WMA. The resulting ATR value is then presented as an easily readable label on your chart, ensuring you're always informed about the market's volatility.
🛠️ ––––HOW TO USE IT––––
ATR Length : Set the desired period for the ATR calculation.
Average Type : Choose your preferred averaging method from EMA, SMA, RMA, or WMA.
Day Period : Select the desired time frame for the ATR calculation: Daily (D), Weekly (W), or Monthly (M).
Label Position : Adjust the position of the ATR label on your chart using the 'Panel Position' and 'Text Size' options.
Banner : Toggle the 'Banner' option to display the ATR label as a banner on your chart.
Interpreting the ATR Label : A higher ATR value indicates greater volatility, while a lower ATR suggests less volatility. Use this information in conjunction with other indicators and analysis techniques to make informed trading decisions.
Carter

TTM Regression°This oscillator attempts to provide context to John Carter's "TTM Squeeze" indicator.
Similar to my MAR° indicator, statistically significant areas based on the past n candles (Lookback) are calculated to provide context for the y-axis values of the TTM indicator.
Note that Carter's squeeze idea has been dropped in favour of the regression bands, in that they offer a clear visual momentum squeeze condition.
The regression bands identify temporary exhaustion of bullish (purple) and bearish (green) momentum; these could potentially be seen as overbought and oversold indications.
The dotted midlines dictate intra-zones where momentum could reverse to continue the larger trend.
All the latter behave similarly to Support and Resistance zones.
The oscillator can also be normalized over a given interval to show results on a scale between 0 and 100, preserving even more context over time.
You should experiment for yourself to find out what is best for you in terms of scale, and Normalization Period.
Normalization Example: on the left you can observe how the momentum is visualized differently based on the scale, given the rapid momentum to the upside.
// –––. Regular
// –––. Normalized
It's crucial to use this oscillator as confluence only and not to take trades based solely on its indications.
At the moment there are no alerts set for this script, open to suggestions :)

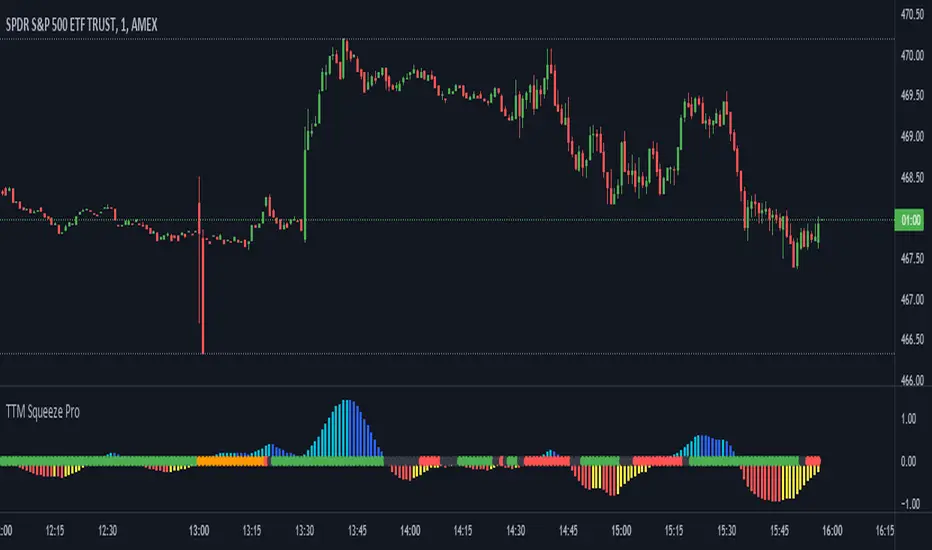
Multi-Timeframe TTM Squeeze Pro
IMPORTANT NOTE:
-> The timeframe for this indicator must be set at 1 minute;
-> If the chart timeframe is higher than 1 minute, the results shown in the table for timeframes lower than the chart will not be correct;
-> Tradingview's own documentation explains this as follows: " It is not recommended to request data of a timeframe lower that the current chart timeframe, for example 1 minute data from a 5 minutes chart. The main problem with such a case is that some part of a 1 minute data will be inevitably lost, as it’s impossible to display it on a 5 minutes chart and not to break the time axis. In such cases the behavior of security can be rather unexpected "; and
-> It is therefore recommended that this indicator is placed in a standalone 1min chart window, and the window resized to only show the table to avoid any issues.
Credits:
-> John Carter creating the TTM Squeeze and TTM Squeeze Pro
-> Lazybear's original interpretation of the TTM Squeeze: Squeeze Momentum Indicator
-> Makit0's evolution of Lazybear's script to factor in the TTM Squeeze Pro upgrades - Squeeze PRO Arrows
This is my version of their collective works, with amendments primarily to the Squeeze Conditions to more accurately reflect the color coding used by the official TMM Squeeze Pro indicator.
TTM Squeeze Guide
For those unfamiliar with the TTM Squeeze, it is simply a visual way of seeing how Bollinger Bands (standard deviations from a simple moving average ) relate to Keltner Channels ( average true range bands) compared with the momentum of the price action. The concept is that as Bollinger Bands compress within Keltner Channels , price volatility decreases, giving way for a potential explosive price movement up or down.
Differences between the original TTM Squeeze and TTM Squeeze Pro:
-> Both use a 2 standard deviation Bollinger Band ;
-> The original squeeze only used a 1.5 ATR Keltner Channel; and
-> The pro version uses 1.0, 1.5 and 2.0 ATR Keltner Channels .
The pro version therefore helps differentiate between levels of squeeze (compression) as the Bollinger Bands moves through the Keltner Channels i.e. the greater the compression, the more potential for explosive moves - less compression means more squeezing.
The Histogram shows price momentum whereas the colored dots (along the zeroline) show where the Bollinger Bands are in relation to the Keltner Channels:
-> Cyan Bars = positive, increasing momentum;
-> Blue Bars = positive, decreasing momentum (indication of a reversal in price direction);
-> Red Bars = negative, increasing momentum;
-> Yellow Bars = negative, decreasing momentum (indication of a reversal in price direction);
-> Orange Dots = High Compression / large squeeze (One or both of the Bollinger Bands is inside the 1st (1.0 ATR) Keltner Channel);
-> Red Dots = Medium Squeeze (One or both of the Bollinger Bands is inside the 2nd (1.5 ATR) Keltner Channel);
-> Black Dots = Low compression / wide squeeze (One or both of the Bollinger Bands is inside the 3rd (2.0 ATR) Keltner Channels );
-> Green Dots = No Squeeze / Squeeze Fired (One or both of the Bollinger Bands is outside of the 3rd (2.0 ATR) Keltner Channel).
Ideal Scenario:
As the ticker enters the squeeze, black dots would warn of the beginning of a low compression squeeze. As the Bollinger bands continue to constrict within the Keltner Channels , red dots would highlight a medium compression. As the price action and momentum continues to compress an orange dot shows warning of high compression. As price action leaves the squeeze, the coloring would reverse e.g. orange to red to black to green. Any compression squeeze is considered fired at the first green dot that appears.
Note: This is an ideal progression of the different types of squeezes, however any type of squeeze (and color sequence) may appear at anytime, therefore the focus is primarily on the green dots after any type of compression.
Entry and Exit Guide:
-> John Carter recommends entering a position after at least 5 black dots or wait for 1st green dot ; and
-> Exit on second blue or yellow bar or, alternatively, remain in the position after confirming a continuing trend through a separate indicator.
Standalone Indicator:
The indicator (which can be used on any timeframe) can be found here:

MTF Radar_vtMTF Radar is like your car dashboard for trading. It is your X-ray machine and, in one glance, you know what price is doing in all major time frames, from 5m to 1Q, without having to flip through multiple charts. Simple and visual!
The Sqz column indicates whether a stock is in consolidation(i.e. in squeeze) or in expansion (fired). Color denotes different compression levels: tight - black, medium - red, low - orange, green - fired.
T1 and T2 are two different trend systems:
T1 - green = bullish trend, red = bearish trend, gray = side ways, yellow - trend change
T2 - green = bullish trend, red = bearish trend, gray = side ways
T1 is a more sensitive system compared to T2.
Momo column shows squeeze momentum bars with matching color.
P+: momentum is positive and increasing. Light blue.
P-: momentum is positive and decreasing. Dark blue.
N+: momentum is negative and increasing. Yellow.
N-: momentum is negative and decreasing. Dark blue.
MTF Radar_vt is a light version of the full indicator and covers:
- most futures market
- 30 stocks in Dow Index
- Index and sector ETFs : SPY, QQQ, DIA, IWM, XLE, XLF, XLU, GDX, XLK, XLV, XLY, XLB, ITB, XRT, SMH, IBB, KRE, XLC, GDXJ, KBE
- Some key stocks: AAPL, AMZN, FB, GOOGL, TSLA, NVDA, NFLX
- Forex pairs: DXY,AUDCAD,AUDJPY,AUDNZD,AUDUSD,EURCAD,EURGBP,EURJPY,EURUSD,GBPJPY,GBPUSD,NZDUSD,USDCAD,USDJPY
Full version works on all stocks and assets. If you like this indicator and require the full version, please contact the author.
Credits:
-> John Carter - creator of TTM Squeeze and TTM Squeeze Pro
-> Lazybear's interpretation of the TTM Squeeze: Squeeze Momentum Indicator

[TTI] ATR channelsHISTORY AND CREDITS
Used by John Carter in his indicator’s toolbox. The ATR channels or the Keltner Channels represent the railroads or the natural movement of stocks.
WHAT IT DOES
Movements between the the The first multiplier lines (white) represent standard movement for the timeframe you are trading. Movements between the second multiplier (green/red lines) represent a 2stdv move of the stock in a single direction. Once a stock starts reaching the 3rd multiplier lines there’s an exponential chance that it will revert to the mean (cyan line)
Additionally, we have added the Institutional lines. These are thought in a Small Account Mastery class 2019 by John Carter, as the levels heavily watched by institutions. The default settings represent what John is teaching but they can be further customised.
HOW TO USE IT
ATRs channels or Keltner Channels can be great source for target or stop losses and can be used as a indicator for confluence with other technical tools like the Fibonacci lines.

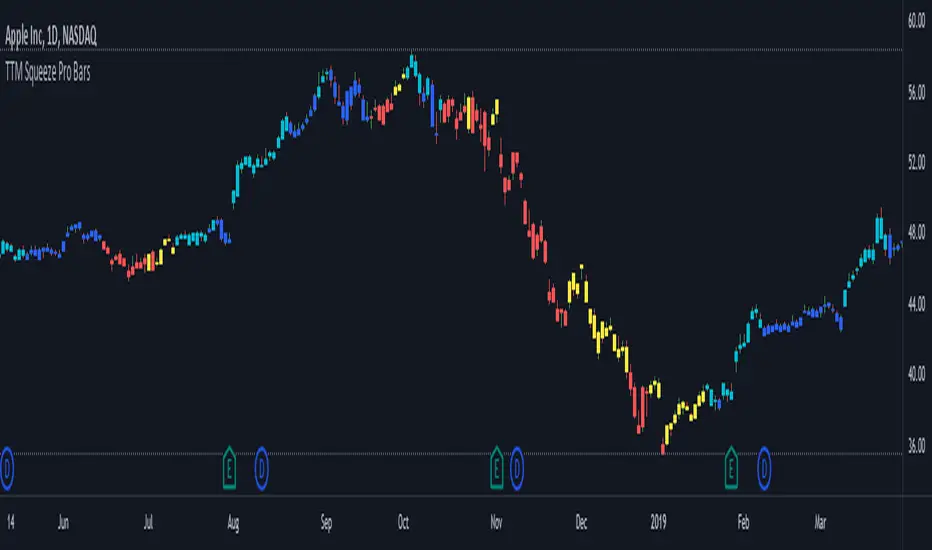
TTM Squeeze Pro BarsCredits:
-> John Carter creating the TTM Squeeze and TTM Squeeze Pro
-> Lazybear's original interpretation of the TTM Squeeze: Squeeze Momentum Indicator
-> Makit0's evolution of Lazybear's script to factor in the TTM Squeeze Pro upgrades - Squeeze PRO Arrows
This is my version of their collective works, with amendments primarily to the Squeeze Conditions to more accurately reflect the color coding used by the official TMM Squeeze Pro indicator.
Rather than having a separate indicator window, the TTM Squeeze Pro is now overlaid on the price bars for easier viewing.
For those unfamiliar with the TTM Squeeze, it is simply a visual way of seeing how Bollinger Bands (standard deviations from a simple moving average ) relate to Keltner Channels ( average true range bands) compared with the momentum of the price action. The concept is that as Bollinger Bands compress within Keltner Channels , price volatility decreases, giving way for a potential explosive price movement up or down.
Differences between the original TTM Squeeze and TTM Squeeze Pro:
-> Both use a 2 standard deviation Bollinger Band ;
-> The original squeeze only used a 1.5 ATR Keltner Channel; and
-> The pro version uses 1.0, 1.5 and 2.0 ATR Keltner Channels .
The pro version therefore helps differentiate between levels of squeeze (compression) as the Bollinger Bands moves through the Keltner Channels i.e. the greater the compression, the more potential for explosive moves - less compression means more squeezing.
The Histogram shows price momentum whereas the colored dots (along the zeroline) show where the Bollinger Bands are in relation to the Keltner Channels:
-> Cyan Bars = positive, increasing momentum;
-> Blue Bars = positive, decreasing momentum (indication of a reversal in price direction);
-> Red Bars = negative, increasing momentum;
-> Yellow Bars = negative, decreasing momentum (indication of a reversal in price direction);
-> Orange Dots = High Compression / large squeeze (One or both of the Bollinger Bands is inside the 1st (1.0 ATR) Keltner Channel);
-> Red Dots = Medium Squeeze (One or both of the Bollinger Bands is inside the 2nd (1.5 ATR) Keltner Channel);
-> Black Dots = Low compression / wide squeeze (One or both of the Bollinger Bands is inside the 3rd (2.0 ATR) Keltner Channels );
-> Green Dots = No Squeeze / Squeeze Fired (One or both of the Bollinger Bands is outside of the 3rd (2.0 ATR) Keltner Channel).
Ideal Scenario:
As the ticker enters the squeeze, black dots would warn of the beginning of a low compression squeeze. As the Bollinger bands continue to constrict within the Keltner Channels , red dots would highlight a medium compression. As the price action and momentum continues to compress an orange dot shows warning of high compression. As price action leaves the squeeze, the coloring would reverse e.g. orange to red to black to green. Any compression squeeze is considered fired at the first green dot that appears.
Note: This is an ideal progression of the different types of squeezes, however any type of squeeze (and color sequence) may appear at anytime, therefore the focus is primarily on the green dots after any type of compression.
Entry and Exit Guide:
-> John Carter recommends entering a position after at least 5 black dots or wait for 1st green dot ; and
-> Exit on second blue or yellow bar or, alternatively, remain in the position after confirming a continuing trend through a separate indicator.
TTM Squeeze ProCredits:
-> John Carter creating the TTM Squeeze and TTM Squeeze Pro
-> Lazybear's original interpretation of the TTM Squeeze: Squeeze Momentum Indicator
-> Makit0's evolution of Lazybear's script to factor in the TTM Squeeze Pro upgrades - Squeeze PRO Arrows
This is my version of their collective works, with amendments primarily to the Squeeze Conditions to more accurately reflect the color coding used by the official TMM Squeeze Pro indicator.
For those unfamiliar with the TTM Squeeze, it is simply a visual way of seeing how Bollinger Bands (standard deviations from a simple moving average ) relate to Keltner Channels (average true range bands) compared with the momentum of the price action. The concept is that as Bollinger Bands compress within Keltner Channels, price volatility decreases, giving way for a potential explosive price movement up or down.
Differences between the original TTM Squeeze and TTM Squeeze Pro:
-> Both use a 2 standard deviation Bollinger Band ;
-> The original squeeze only used a 1.5 ATR Keltner Channel; and
-> The pro version uses 1.0, 1.5 and 2.0 ATR Keltner Channels .
The pro version therefore helps differentiate between levels of squeeze (compression) as the Bollinger Bands moves through the Keltner Channels i.e. the greater the compression, the more potential for explosive moves - less compression means more squeezing.
The Histogram shows price momentum whereas the colored dots (along the zeroline) show where the Bollinger Bands are in relation to the Keltner Channels:
-> Cyan Bars = positive, increasing momentum;
-> Blue Bars = positive, decreasing momentum (indication of a reversal in price direction);
-> Red Bars = negative, increasing momentum;
-> Yellow Bars = negative, decreasing momentum (indication of a reversal in price direction);
-> Orange Dots = High Compression / large squeeze (One or both of the Bollinger Bands is inside the 1st (1.0 ATR) Keltner Channel);
-> Red Dots = Medium Squeeze (One or both of the Bollinger Bands is inside the 2nd (1.5 ATR) Keltner Channel);
-> Black Dots = Low compression / wide squeeze (One or both of the Bollinger Bands is inside the 3rd (2.0 ATR) Keltner Channels );
-> Green Dots = No Squeeze / Squeeze Fired (One or both of the Bollinger Bands is outside of the 3rd (2.0 ATR) Keltner Channel).
Ideal Scenario:
As the ticker enters the squeeze, black dots would warn of the beginning of a low compression squeeze. As the Bollinger bands continue to constrict within the Keltner Channels , red dots would highlight a medium compression. As the price action and momentum continues to compress an orange dot shows warning of high compression. As price action leaves the squeeze, the coloring would reverse e.g. orange to red to black to green. Any compression squeeze is considered fired at the first green dot that appears.
Note: This is an ideal progression of the different types of squeezes, however any type of squeeze (and color sequence) may appear at anytime, therefore the focus is primarily on the green dots after any type of compression.
Entry and Exit Guide:
-> John Carter recommends entering a position after at least 5 black dots or wait for 1st green dot ; and
-> Exit on second blue or yellow bar or, alternatively, remain in the position after confirming a continuing trend through a separate indicator.
KLM SqueezeThis version corrects a big error that other published versions include.
The John F. Carter setup for the Squeeze mixes 3 major indicators:
- Bollinger bands
- Keltner channel
- Momentum (oscilator)
All these 3 indicators combined create a great way of measuring your entries on a trade and can be used on all timeframes.
Several other versions published on trading view, use incorrect parameters for some of their indicators, which leads to wrong setups.
Based on John F. Carter's book, "Mastering the trade" , I put up this with the correct and original indicator values.
Use it wisely and check John's book for better mastering the trades :)

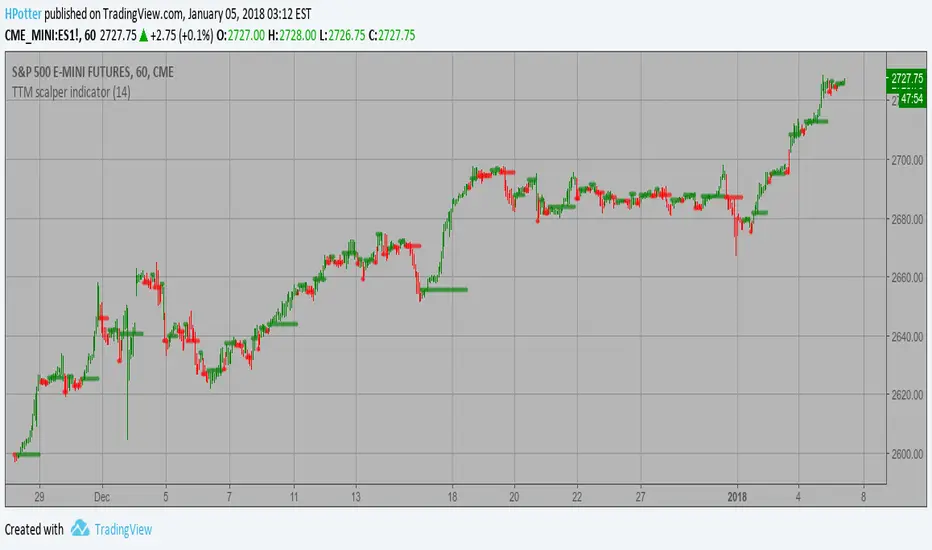
TTM scalper indicator Backtest TTM scalper indicator of John Carter’s Scalper Buys and Sells. The methodology
is a close approximation of the one described in his book Mastering the Trade.
The book is highly recommended. Note the squares are not real-time but will
show up once the third bar has confirmed a reversal.
You can change long to short in the Input Settings
WARNING:
- For purpose educate only
- This script to change bars colors.

TTM scalper indicator Strategy TTM scalper indicator of John Carter’s Scalper Buys and Sells. The methodology
is a close approximation of the one described in his book Mastering the Trade.
The book is highly recommended. Note the squares are not real-time but will
show up once the third bar has confirmed a reversal.
WARNING:
- This script to change bars colors.
Simpler Trading SqueezeWhen the Bollinger Bands cross inside the Keltner Channels this indicates a quiet period in the market AKA “it’s in a squeeze” and when the “squeeze fires” this means the Bollinger Bands have crossed outside of the Keltner Channels and price is moving.
The oscillator is a momentum indicator identifying which direction the squeeze has fired. If a squeeze “loses momentum” that means the move is over.
Again, the indicators that embody the Squeeze is available for free on all trading platforms, BUT if you don’t want to go cross eyed looking at all the squiggle lines and want an easy to use visual representation then pick up the Squeeze for your trading platform today.

UCS_TTM - Reversion BandsOk, Here we go - Version 1 of TTM Reversion Band goes live.
Link to TTM Reversion Band - www.tradethemarkets.com
Link to TTM Reversion Band Guide - kb.simplertrading.com
John Carters Mastering the trade - www.amazon.com
For the amount of information this has, the price tag is not hefty.
John's RTM Chapter Synopsis - www.tradethemarkets.com
What did I modify?
1. Automated the Daily + and Intraday settings. So Switching to intraday will change the setting automatically.
2. Added text callouts for RTM condition
a. John Carter's Indicator
b. Slope Based (my addition).
Future Improvement Planned.
1. Will Convert this into a system based on John's Indicator from TS.
2. Custom Options for Slope and MA setting for Trade filter.

UCS_TTM_Wave A & B & CThis is a replica of TTM Wave A B C.
The ABC Waves are comprised of various moving averages and oscillators (MACD) used to visualize the overall strength and direction of a given market across multiple time frames.
The “A Wave” measures short term relative strength and direction of a market, the “C Wave” measures longer term strength and the “B Wave” plots the same for a medium time period.
Here is the link to the ACTUAL Indicator - members.simpleroptions.com
Instruction -
Load the Indicator three times, Turn Off the Other two Waves. For eg., Wave A - Check / Wave B - Uncheck / Wave C - Uncheck. = This will plot Wave A.
