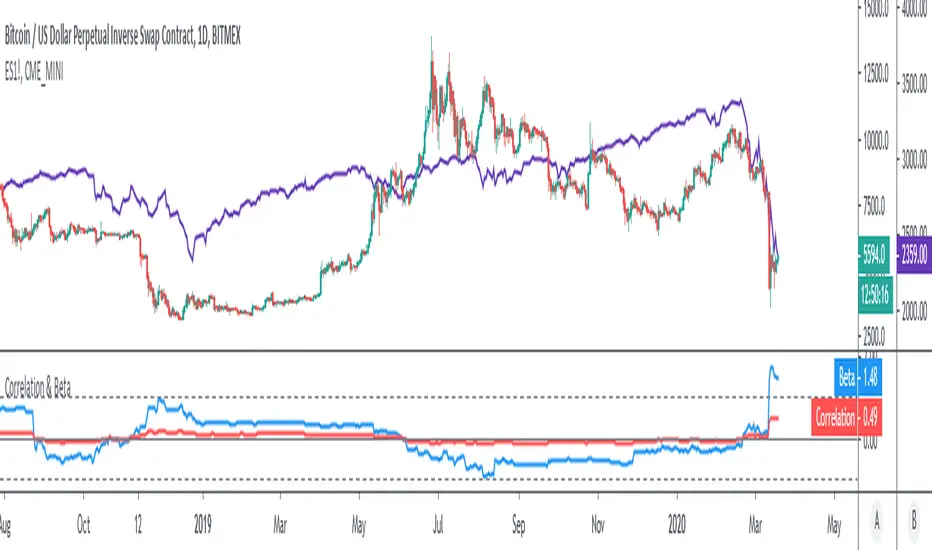
Bitcoin Correlated Market DirectionIdentifies which major market is "controlling" Bitcoin and what direction that market is moving in.
Helps to identify confluence of trend or potential turning points for Bitcoin.
Blue = stocks in control and bullish
Purple = stocks in control and bearish
Orange = gold in control and bullish
Red = gold in control and bearish
コモディティ

Kaya RSI BASED INFLATION INDICATORUse your own risk.
This indicator aims look inflation of your emita according to the BTC and XAU. Also you can use Dxy too. The main idea of behind of this indicator is rsi. But not normal rsi :).
For example. If green(XAU) line upper then xau going to up better than BTC and your emita. If red line (BTC) is upper, thats mean buying BTC can be more profitably. Blue line (named Normal means this is your emita) is upper that mean your emita is can be more profitably than the others. You can think opposite for lower situations.
Be aware this is not mean percent rising or declining. This is just understanding for which of them (relatively) moving how according to the rsi.
Maybe it can using for positons too. But I didnt test it. So be carefull.
Best Regards.

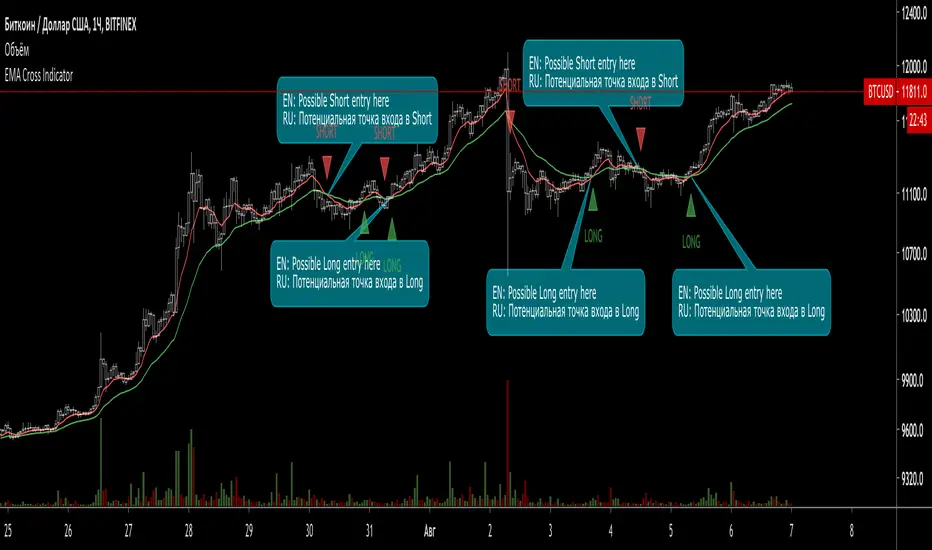
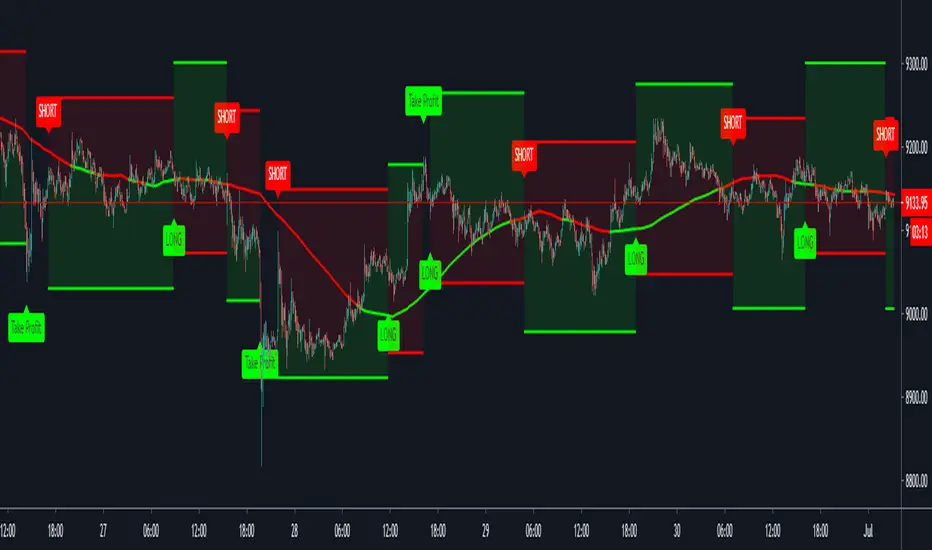
EMA Cross Indicator (with signals)This indicator shows 2 EMA (Long and Short) Cross and gives a possible entry point for a trade.
When Short EMA (red line) line crosses Long EMA (green) from bottom to top - this is a possible Long trade entry point.
When Long EMA (green line) line crosses Short EMA (red) from bottom to top - this is a possible Short trade entry point.
In both cases (basically, all the crossovers) are indicated with "Long" and "Short" labels.
Works with Crypto (from 30 min timeframe and higher)
Stocks (from 1 hour timeframe and higher)
Commodities (from 1 hour timeframe and higher)
Forex (from 1 hour timeframe and higher)
Consider using it with respect to Your trading style, money- and risk-management as well as other indicators.
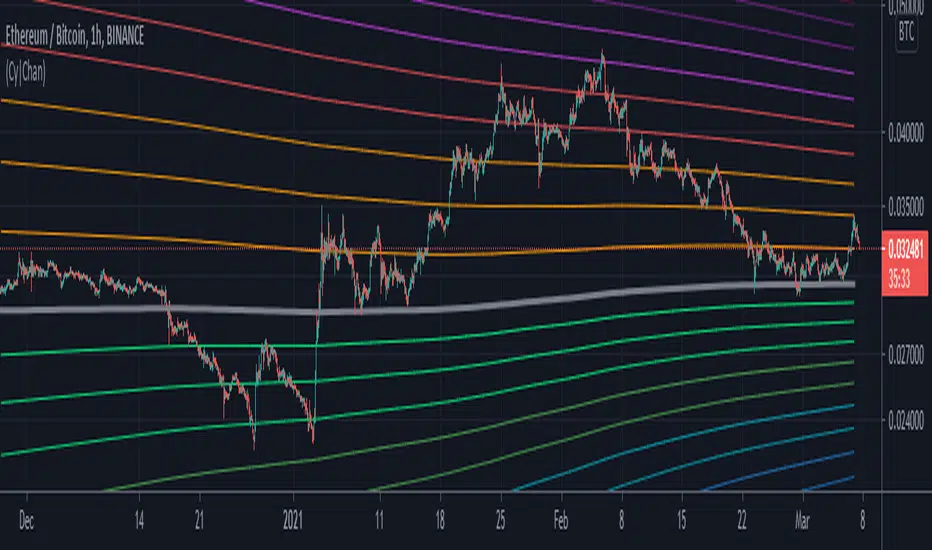
Cyber ChannelStandard deviation levels to determine if the price is over-extended in the positive/negative direction about the user defined MA line.
Historical confluence with the different levels can be used to estimate and predict the probability of a significant price retracement within given time-scale; and to help anticipate if the price is nearing local or all-time highs/lows.
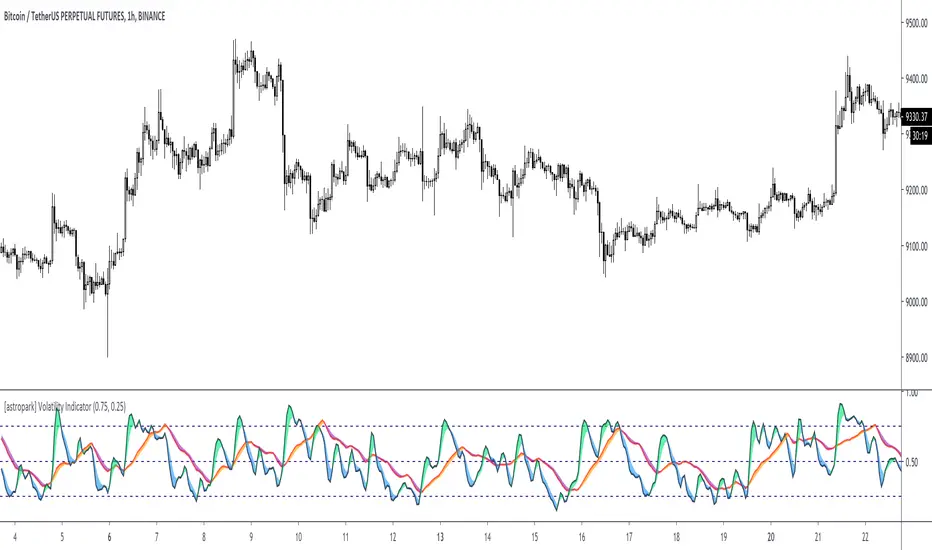
[astropark] Volatility IndicatorDear Followers,
today another interesting script: Volatility Indicator .
This indicator measures the volatility of the market you see in the timeframe you see, in a scale between 0 and 1.
It works on cryptocurrencies, commodities, stocks, indexes and forex.
You will see 2 volatility waves:
a black one (with green and blue shadow for increasing and decreasing mode), which is the "faster" one
a red one (with orange and purple shadow for increasing and decreasing mode), which is the "slower" one
The indicator highlights high volatility when it's near the top (1), while low volatility when near the bottom (0).
You can combine this indicator with your own strategy and indicators to validate them :
on low volatility it often happens that a signal fails to be profitable, as it lacks fuel
while it's better if volatility is over low level as price has more room to run while volatility increasing to the top
This indicator also lets you set alerts when volatility exceeds high level or low level.
This is a premium indicator , so send me a private message in order to get access to this script.
XAGUSD Long/Short Signal ~ By: Sarp GokdagAbout the Oscillator :
The Rex Oscillator is a study that measures market behavior based on the relationship of the close to the open, high and low values of the same bar. The theory behind the Rex Oscillator is that a big difference between the high and close on a bar indicates weakness. Conversely, wide disparity between the low and close indicates strength. The difference between open and close also indicates market performance.
The True Value of a Bar (TVB) gives us an indication of how healthy the market is. It is possible to have a negative close and a positive TVB, and vice versa. This indicates that the market is building strength on the opposing side of the trend. The Rex Oscillator is a moving average of the TVB, indicating the inertia of the market. When the Rex Oscillator turns positive in a bearish trend, a reversal is indicated. Likewise, Rex turning negative in a bull market indicates a reversal to the downside.
When the Rex Oscillator turns positive in a bearish trend, a reversal is indicated. Likewise, Rex turning negative in a bull market indicates a reversal to the downside.
The REX Strategy goes long when the REX line of the REX Oscillator crosses above the Signal line and Short when the REX line crosses below the Signal line. The strategy is a reversal strategy through the use of the 'Cover and go Long' and 'Close and go Short' Actions. The REX Oscillator properties of Period' and Signal' can be changed for testing purposes using the available Rex1 'Factor.'
The blue line indicates the difference between the Rex MA and the Signal.
If the blue line crosses above "0", go Long.
If the blue line crosses below "0", go Short.
To achieve best results from this strategy, set your chart range minimum 4hrs, max 1 Day.
The above references an opinion and is for information purposes only. It is not intended to be investment advice. Seek a duly licensed professional for investment advice.

Trading Psychology - Fear & Greed Index by DGTPsychology of a Market Cycle - Where are we in the cycle?
Before proceeding with the question "where", let's first have a quick look at "What is market psychology?"
Market psychology is the idea that the movements of a market reflect the emotional state of its participants. It is one of the main topics of behavioral economics - an interdisciplinary field that investigates the various factors that precede economic decisions. Many believe that emotions are the main driving force behind the shifts of financial markets and that the overall fluctuating investor sentiment is what creates the so-called psychological market cycles - which is also dynamic.
Stages of Investor Emotions:
* Optimism – A positive outlook encourages us about the future, leading us to buy stocks.
* Excitement – Having seen some of our initial ideas work, we begin considering what our market success could allow us to accomplish.
* Thrill – At this point we investors cannot believe our success and begin to comment on how smart we are.
* Euphoria – This marks the point of maximum financial risk. Having seen every decision result in quick, easy profits, we begin to ignore risk and expect every trade to become profitable.
* Anxiety – For the first time the market moves against us. Having never stared at unrealized losses, we tell ourselves we are long-term investors and that all our ideas will eventually work.
* Denial – When markets have not rebounded, yet we do not know how to respond, we begin denying either that we made poor choices or that things will not improve shortly.
* Fear – The market realities become confusing. We believe the stocks we own will never move in our favor.
* Desperation – Not knowing how to act, we grasp at any idea that will allow us to get back to breakeven.
* Panic – Having exhausted all ideas, we are at a loss for what to do next.
* Capitulation – Deciding our portfolio will never increase again, we sell all our stocks to avoid any future losses.
* Despondency – After exiting the markets we do not want to buy stocks ever again. This often marks the moment of greatest financial opportunity.
* Depression – Not knowing how we could be so foolish, we are left trying to understand our actions.
* Hope – Eventually we return to the realization that markets move in cycles, and we begin looking for our next opportunity.
* Relief – Having bought a stock that turned profitable, we renew our faith that there is a future in investing.
It's hard to predict with certainty where we exactly are in the market cycle, we can only make an educated guess as to the rough stage based on data available. And here comes the study "Trading Psychology - Fear & Greed Index"
Factors taken into account in this study include:
1-Price Momentum : Price Divergence/Convergence versus its Slow Moving Average
2-Strenght : Rate of Return (RoR) also called Return on Investment (ROI) is a performance measure used to evaluate the efficiency of an investment, net gain or loss of an investment over a specified time period, the rate of change in price movement over a period of time to help investors determine the strength
3-Money Flow : Chaikin Money Flow (CMF) is a technical analysis indicator used to measure Money Flow Volume over a set period of time. CMF can be used as a way to further quantify changes in buying and selling pressure and can help to anticipate future changes and therefore trading opportunities. CMF calculations is based on Accumulation/Distribution
4-Market Volatility : CBOE Volatility Index (VIX), the Volatility Index, or VIX, is a real-time market index that represents the market's expectation of 30-day forward-looking volatility. Derived from the price inputs of the S&P 500 index options, it provides a measure of market risk and investors' sentiments. It is also known by other names like "Fear Gauge" or "Fear Index." Investors, research analysts and portfolio managers look to VIX values as a way to measure market risk, fear and stress before they take investment decisions
5-Safe Haven Demand : in this study GOLD demand is assumed
What to look for :
*Fear and Greed Index as explained above,
*Divergencies
Tool tip of the label displayed provides details of references
Conclusion:
As investors, we always get caught up in the day to day price movements, and lose sight of the bigger picture. The biggest crashes happen not when investors are cautious and fearful, it's when they're euphoric and expecting financial instruments to continue going higher. So as we continue investing, don’t forget to stop and ask yourself, where in the chart do you think we are right now? The Market Psychology Cycle shines light on how emotions evolve, fear and greed index can come in handy, provided that it is not the only tool used to make investment decisions. It is easy to look back at market cycles and recognize how the overall psychology changed. Analyzing previous data makes it obvious what actions and decisions would have been the most profitable. However, it is much harder to understand how the market is changing as it goes - and even harder to predict what comes next. Many investors use technical analysis (TA) to attempt to anticipate where the market is likely to go. Investors are advised to keep tabs on fear for potential buying the dips opportunities and view periods of greed as a potential indicator that financial instruments might be overvalued.
Warren Buffett's quote, buy when others are fearful, and sell when others are greedy
Trading success is all about following your trading strategy and the indicators should fit within your trading strategy, and not to be traded upon solely
Disclaimer : The script is for informational and educational purposes only. Use of the script does not constitute professional and/or financial advice. You alone have the sole responsibility of evaluating the script output and risks associated with the use of the script. In exchange for using the script, you agree not to hold dgtrd TradingView user liable for any possible claim for damages arising from any decision you make based on use of the script

MTF TZ-CXThis is a Beta version of Trend Indicator using Multi Time Frame Analysis to suggest a long or a short
the main use of this indicator is quick scalping and Intra-day trading.
The Indicator shows the option to show the Trend Zone and Buy/Sell Signals which the use can on or off
Also to avoid false positives we have introduced a double check using RSI,
it is defaulted to 60/30 - the users are free to change it as per their preferences
The system will not suggest a trade when the the counter in inside the RSI limits
Stop Loss - That should be done by following ones risk appetite , Ideally the open/close of the previous candle should be the stop loss for the buy/sell
but everyone has their own Risk Management Strategies based on the capital deployed.
Disclaimer : There could be scenarios when the candle is shown as a long or short and then the candle turns into opposite direction red/green .
In such scenarios , Please refer to the just preceding candle and if this candle is moving into positive direction (forming green candle) only then buy ,
Similarly Sell/Short only if this candle is forming a red candle

HFT Scalper IndicatorThis strategy is a scalper strategy developed by HFT Research. Scalper is highly customizable and provides endless opportunities to find profitable setups in the market.
Use Bollinger Bands
This piece of the settings will turn and off Bollinger band’s input in the decision making. BB Length will determine the Moving average you are using to take the standard deviation off of which is named as BB Multiplier. Default settings will use 20 moving average and take standard deviation of 2 to create lower and upper bands. Increasing the Multiplier will give you fewer but safer entries.
Use Bollinger Bands %
This setting will allow the user to determine at what Bollinger band width %, he wants to take start looking to take trades. It is known that when prices are stable and moving sideways, Bollinger bands contract and it becomes more reactive to small moves in the market. Using this setting, you can ignore the signals that would be generated while Bollinger bands are contracted. This setting will allow the user to weed out the noise in the market and really allow them to make the most out of Bollinger bands.
Use RSI
You can also turn on and off the RSI as well. Alternatively, there is an option to use RSI on a different time frame than you are currently on. For example, if you are looking at the 5min chart to use Bollinger bands but you would like to look at the RSI value on the 15min chart. You can do so by selecting the custom RSI timeframe as well as adjusting the Oversold and Overbought value.
Use STOCH
For those who want extra protection on their entry can throw STOCH into their decision making. STOCH acts like RSI but it is more prone to small moves. It will help the users to get a better entry if used correctly. Stoch may not be in the buy zone when RSI is at say 35, however, if price dips a little more and STOCH might be in the buy zone when RSI is at say 20. This way it will help you have better entries than just using RSI. In a way, you can use STOCH to scalp RSI.
Use VWAP
VWAP stands for volume weighted average price. It is an extremely useful indicator when trading intra-day. It does reset every trading session which is at 00:00 UTC. Instead of looking at x number of candles and providing an average price, it will take into consideration volume that’s traded at a certain price and weigh it accordingly.
Use ADX
ADX stands for average directional index. It is an indicator that measures volatility in the market. Unfortunately, the worst market condition for this strategy is sideways market. ADX becomes a useful tool since it can detect trend. If the volatility is low and there is no real price movement, ADX will pick that up and will not let you get in trades during a sideways market. It will allow you to enter trades only when the market is trending.
Use MA Filters
Lookback: It is an option to look back x number of candles to validate the price crossing. If the market is choppy and the price keeps crossing up and down the moving average you have chosen, it will generate a lot of “noisy” signals. This option allows you to confirm the cross by selecting how many candles the price needs to stay above or below the moving average. Setting it 0 will turn it off.
MA Filter Type: There is a selection of moving averages that is available on TradingView currently. You can choose from 14 different moving average types to detect the trend as accurate as possible.
Filter Length: You can select the length of your moving average. Most commonly used length being 50,100 and 200.
Filter Type: This is our propriety smoothing method in order to make the moving averages lag less and influence the way they are calculated slightly. Type 1 being the normal calculation and type 2 being the secret sauce.
Reverse MA Filter: This option allows you to use the moving average in reverse. For example, the strategy will go long when the price is above the moving average. However, if you use the reserve MA Filter, you will go short when the price is above the moving average. This method works best in sideways market where price usually retraces back to the moving average. So in an anticipation of price reverting back to the moving average, it is a useful piece of option to use during sideway markets which is the worst market condition for scalper.
Please visit our website for more information

Quickie (Free) IndicatorQuickie is a free tradingview Indicator developed by HFT Research. It works in sideways and trending markets depending the way you set it as well as both on short time frame and long time frame. It comes with backtesting abilities on tradingview.
You can find the alerts to go long and short here, please check the backtester to fine tune your strategy.
Use Bollinger Bands
This piece of the settings will turn and off Bollinger band’s input in the decision making. BB Length will determine the Moving average you are using to take the standard deviation off of which is named as BB Multiplier. Default settings will use 20 moving average and take standard deviation of 2 to create lower and upper bands. Increasing the Multiplier will give you fewer but safer entries
Use RSI
You can also turn on and off the RSI as well. Alternatively, there is an option to use RSI on a different time frame than you are currently on. For example, if you are looking at the 5min chart to use Bollinger bands but you would like to look at the RSI value on the 15min chart. You can do so by selecting the custom RSI timeframe as well as adjusting the Oversold and Overbought value.
Use MA Filter
Lookback: The indicator has an option to look back x number of candles to validate the price crossing. If the market is choppy and the price keeps crossing up and down the moving average you have chosen, it will generate a lot of “noisy” signals. This option allows you to confirm the cross by selecting how many candles the price needs to stay above or below the moving average. Setting it 0 will turn it off.
MA Filter Type: There is a selection of moving averages that is available on TradingView currently. You can choose from 14 different moving average types to detect the trend as accurate as possible.
Filter Length: You can select the length of your moving average. Most commonly used length being 50,100 and 200.
Filter Type: This is our propriety smoothing method in order to make the moving averages lag less and influence the way they are calculated slightly. Type 1 being the normal calculation and type 2 being the secret sauce .
Reverse MA Filter: This option allows you to use the moving average in reverse. For example, the strategy will go long when the price is above the moving average. However, if you use the reserve MA Filter, you will go short when the price is above the moving average. This method works best in sideways market where price usually retraces back to the moving average. So, in an anticipation of price reverting back to the moving average, it is a useful piece of option to use during sideway markets.
For more information please check out our website
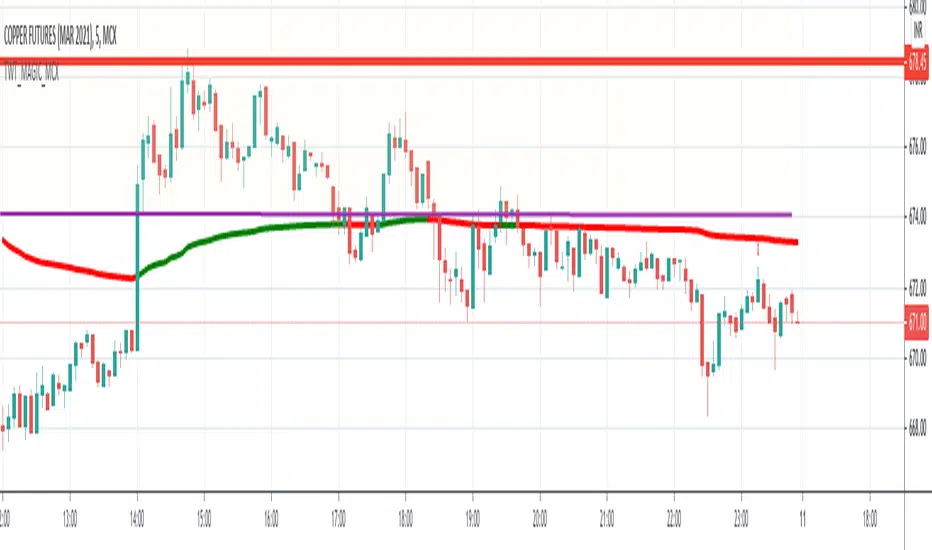
TWT_MAGIC_MCXDescription:
TWT_MAGIC_MCX is designed to trade the MCX commodities for overnight positions.
The logic behind this is to calculate the closing price based on today's price action and come up with suggestion at end of the closing to BUY or SELL for Next Day.
How to Trade::
if on a 5 Minute Chart, the GREEN arrow appears at 23:25 Candlestick then Enter BUY position
if on a 5 Minute Chart, the RED arrow appears at 23:25 Candlestick then Enter SELL position
if on a 5 Minute Chart, no arrow appears at 23:25 Candlestick then Do not take any trade.
Trade need to be taken between 23:25 to 23:30
Profit/SL need to booked at next morning.
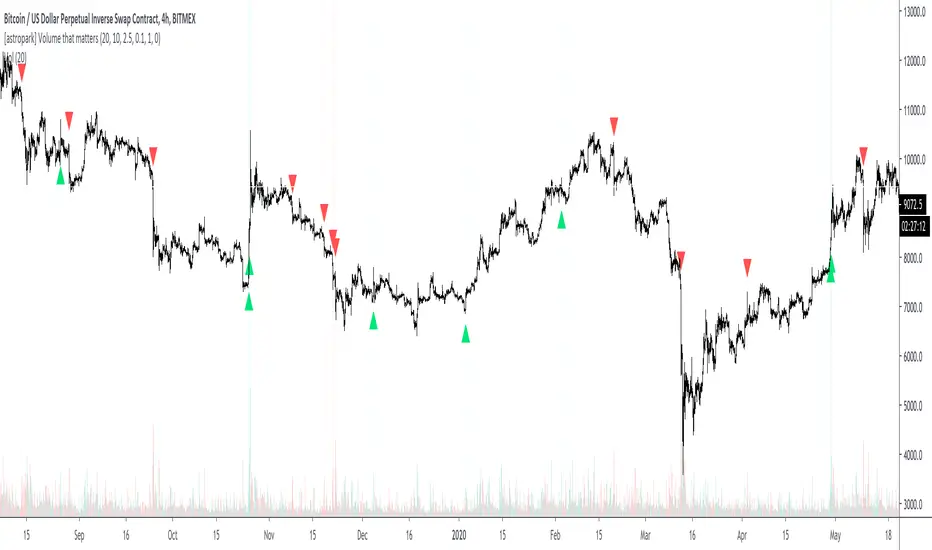
[astropark] Volume that mattersDear Followers,
does volume say something about market makers and what will happen in near future?
Today a new Price Action Tool , the "Volume that matters" indicator.
When a Market Maker executes his/her orders, there is no way he/she can do it without giving us some footprints: volume!
Specific Volume spikes happen as
reactions at support or resistance range , as well as at supply and demand zones
market makers' actions
trend switching in short-term and mid-term future
They can be both bullish or bearish , but the real problem is that not all, but only a few volume candle matters ! And this tool will filter them for you.
This indicator works
on every timeframe (eg. 15m, 30m, 1h, 2h, 4h, 6h, 1D, ...), the higher, the better!
on cryptocurrencies (eg. XBTUSD, ETHUSD, ETHBTC, both USDT and BTC markets, ...)
on forex (eg. EURUSD, GPBUSD, JPYUSD, ...)
on stocks (eg. AMZN, FB, TSLA, GOOG, NFLX, ...)
on commodities (eg. GOLD, SILVER, OIL, ...)
This indicator has following options:
edit volume filter and period analysis
edit filter based on fixed or percentage volatility change
edit filter based on candle value size
show a suggestion of possible entries and stoploss
You can enhance your trading by using it together with my "Engulfing that matters", my "Pinbar that matters" and my "Breaker Blocks (BB) and Supply/Demand Order Blocks (OB)" indicators, so you can easily spot confluences and have more confidence in trades.
Here my Engulfing that matters indicator
Here my Pinbar that matters indicator
Here my Breaker Blocks (BB) and Supply/Demand Order Blocks (OB) indicator
Here below some examples on how to use the indicator.
BTCUSDT 1D
ETHUSD 4h
LINKBTC 1h
EURUSD 4h
AMZN 1h
XAUUSD 4h
Here below an example of suggested entries and stoploss
This is a premium indicator , so send me a private message in order to get access to this script .
Intraday BUY/SELLBUY & SELL Scalp Signals for Crude Oil Future Contracts (Or it can be used with any scrip with good amount of Volume) based on Sma & RSI overbought/oversold alert (!) for possible reversal indication.
Take Buy position only if candle breaks the high of alert candle & for Sell positions, take position if candle breaks low of the alert candle.
Best to perform with 3 min timeframe on Crude Oil Futures

[astropark] Pinbar that mattersDear Followers,
today a new Price Action Tool , the "Pinbar that matters" , also known as Hammer (bullish case) and Inverted Hammer (bearish case).
Everybody knows the importance of pinbar to highlight
reaction at support or resistance range , as well as at supply and demand zones
market makers' actions
trend switching in short-term and mid-term future
They can be both bullish or bearish , but the real problem is that not all, but only a few pinbar matters ! And this tool will filter them for you.
This indicator works
on every timeframe (eg. 5m, 15m, 30m, 1h, 2h, 4h, 6h, 1D, ...)
on cryptocurrencies (eg. XBTUSD, ETHUSD, ETHBTC, both USDT and BTC markets, ...)
on forex (eg. EURUSD, GPBUSD, JPYUSD, ...)
on stocks (eg. AMZN, FB, TSLA, GOOG, NFLX, ...)
on commodities (eg. GOLD, SILVER, OIL, ...)
This indicator has following options:
edit filter based on fixed or percentage volatility change
edit filter based on candle value size
show a suggestion of possible entries and stoploss
Be sure to edit both fixed and percentage volatility options in order to have a correct filter on your chart and timeframe.
You can enhance your trading by using it together with my "Engulfing that matters" and my "Breaker Blocks (BB) and Supply/Demand Order Blocks (OB)" indicators, so you can easily spot important points where to start a short or a long trade.
Here my Engulfing that matters indicator
Here my Breaker Blocks (BB) and Supply/Demand Order Blocks (OB) indicator
Here below some examples on how to use the indicator.
XBTUSD 5m
ETHUSD 15m
BNBBTC 1h
ETHBTC 12h
EURUSD 1h
JPYUSD 4h
AMZN 5m
FB 4h
XAUUSD 15m
Copper Futures 1h
Here below an example of suggested entries and stoploss
This is a premium indicator , so send me a private message in order to get access to this script .

[astropark] Fair Value GapsDear Followers,
today a new epic tool, the "Fair Value Gap (FVG) Finder" .
Fair Value Gaps are quite important to trade, as they represent both volume and trading unfilled gaps, which most of the time are filled and then price reverse .
This indicator will let you set alerts on when a new FVG is found and when it is filled.
Traded together with Breaker Blocks (BB) and Supply/Demand Order Blocks (OB) , you can easily spot important points where to start a short or a long trade.
Here my Breaker Blocks (BB) and Supply/Demand Order Blocks (OB) indicator
Here below some examples on how to use the indicator.
On Bitcoin
On EURUSD

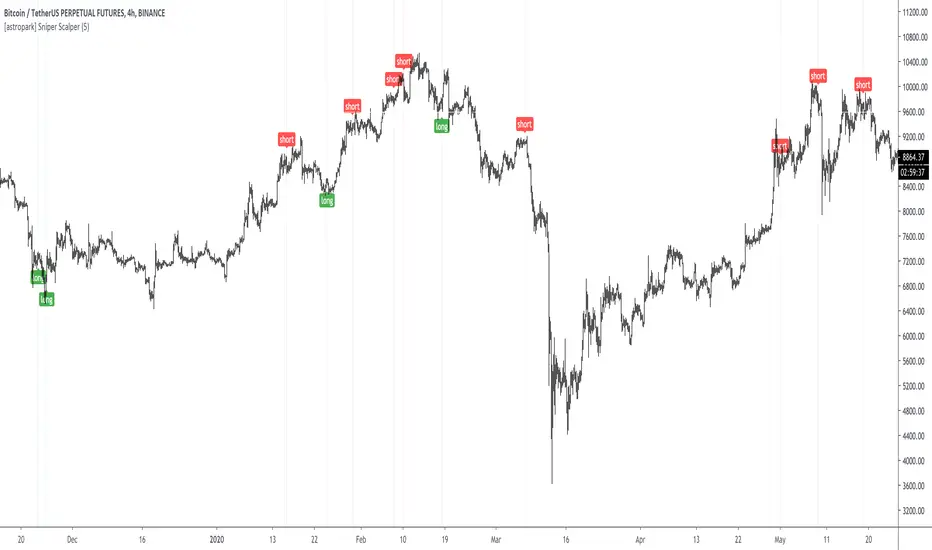
[astropark] Sniper ScalperDear Followers,
today a new Scalper Tool , which works great on all timeframes , from 1 minute to 1 month!
Keep in mind that this is a Scalper, so it's always a good idea to take or lock your profits, despite you may use it also for swing trading.
This tool has some cool features:
it works on all timeframes , from 1 minute to 1 month!
you can change a filter option from 1 (lowest) to 7 (highest)
Here some examples on how it performs on many timeframes and charts.
EURUSD 15m chart
AMZN 1h chart
Bitmex XBTUSD 4h chart
Bitfinex ETHUSD 1h chart
Binance Chainlink LINKBTC 1h chart
Binance Ethereum ETHBTC 1h chart
GOLD XAUUSD 15m chart
The user who wants to use this strategy, especially via an automated bot, must always manage to set a take profit and stoploss, as well as use a proper money and risk management strategies .
This is not the "Holy Grail", so use it with caution.
This is a premium indicator , so send me a private message in order to get access to this script.
Borsa İstanbul Correlation Analysis&Center of Gravity IndicatorFormula Used :
COG = SUM of closing prices Pn x (n+1) / Sum of closing prices Pn

Portfolio and Risk Management: Gold Based Net Growth CoefficientHello, if our topic is stocks, whatever signal we get, we have to divide and reduce the risk.
Apart from the risk, we need inflation-free figures to detect a clear growth.
Gold is one of the most successful tools to beat inflation in this regard in the historical context.
When the economy is good, we have to beat both commodities and inflation.
For this purpose, I found it appropriate to develop a net growth factor free from gold growth.
Investors need several stocks with a high growth rate and as much risk-free as possible.
Personally, I think that the science of portfolio and risk management will last a lifetime and should continue.
I think this subject is a research and development subject.(R & D)
My research and publications on this matter will continue publicly.
I wish everyone a good day.
NOTE : You can determine the return in the time period you want to look back by adjusting the period in the rate you want from the menu.
The standard value is 200 days. (1 year)

Open Close Profit - [Alerts]This script comes with the following indicators and features:
Moving Average trend filter (Hull, ZLEMA, McGinley)
Pin Bar Filter
MACD indicator
Pump and Dump filter
Entry, Take Profit, and Stop Loss Alerts
And a few more indicators in the back-end to increase accuracy, optimize entries and filter out sideways PA
This script works really well as a scalper on lower Time Frames as well as on higher Time Frames. Besides that you can also use it on pretty much any coin or asset.
This script is not repainting. We advise to use alerts on “Once Per Bar Close”.
If you’d like to automate this script you can do that by using AutoView, ProfitView, ProfitTrailer, CryptoHopper etc.
Leave a message if you’d like to try it out.

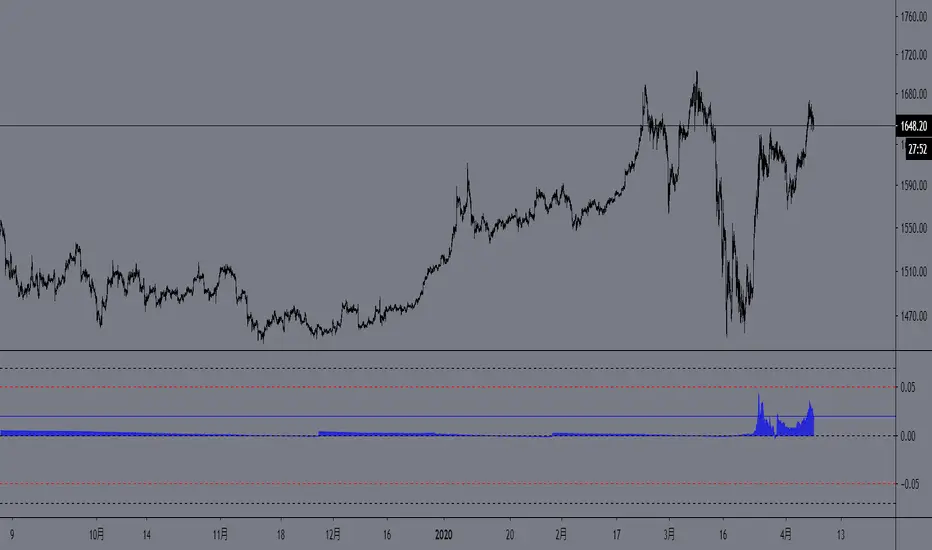
Deviation from the futures market for GOLDThis indicator shows the deviation from the gold futures market.
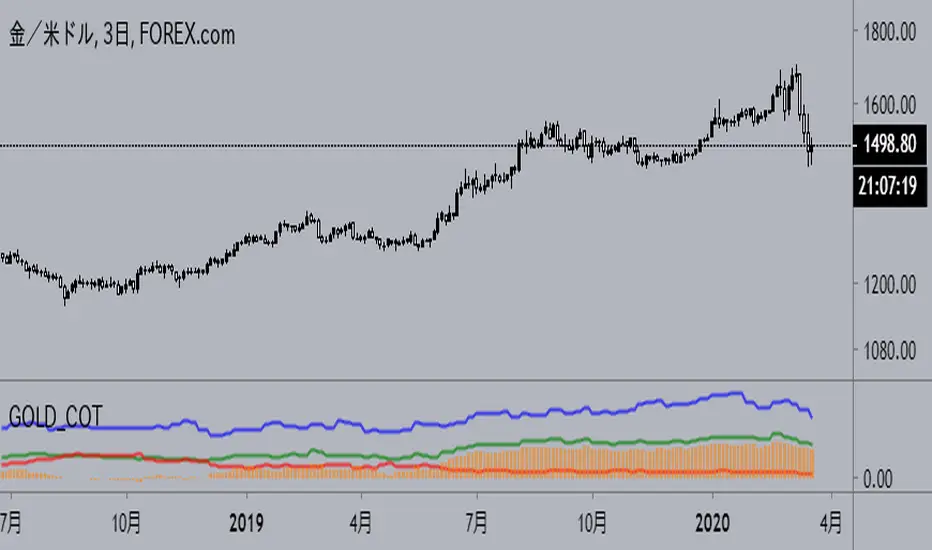
GOLD_COTThis indicator shows GOLD_COT.
Uniqueness: You can show open interest in addition to long, short and net positions.
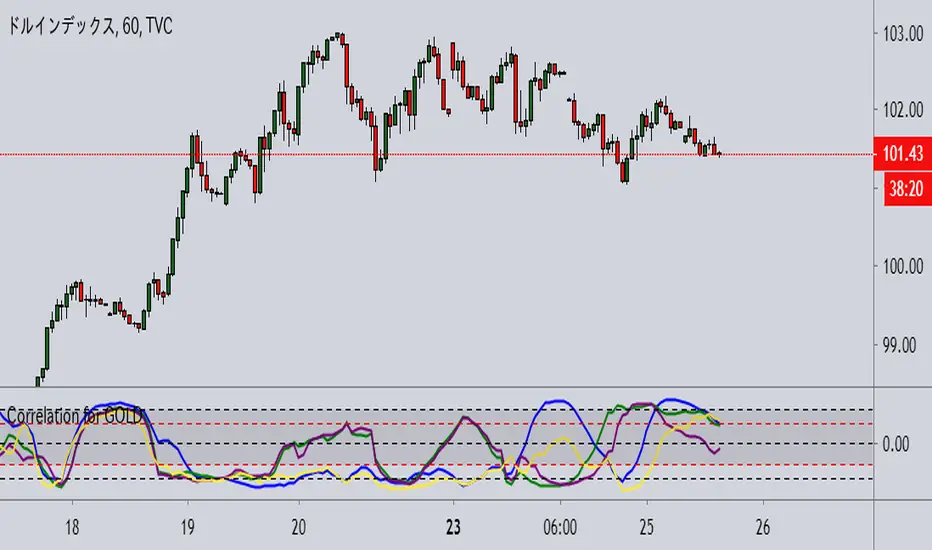
Correlation & BetaDisplay the correlation coefficient and/or Beta of an asset to a specified market.
Options to:
- Specify market (S&P500 futures by default)
- Display one or other metrics
- Modify assessment period (200 bars by default)
- Calculate on price, returns or log-returns