Crash Prevention OpenSource by exp3rtsOpen Source Version - no updates!
Crash Prevention OpenSource by exp3rts – Automated Exit Strategy for TradingView
This indicator allows you to automatically close positions based on dynamic price levels derived from the previous candle with a configurable offset. Perfect for risk management and automated “hard stop” exits.
Key Features:
Flexible Exit Directions: Choose to trigger exits for Long, Short, or Both directions.
Dynamic Exit Levels: Lines are automatically calculated above/below the previous candle plus/minus a user-defined offset in points.
Visual Cues: Clear arrows indicate the exact bar where price touched the exit line.
Session-Independent: Works on any chart and timeframe without manual adjustments.
Webhook Alerts: Sends JSON alerts on touch, enabling integration with external systems or bots.
Auto-Close Logic: Ensures positions are closed immediately when the threshold is breached, keeping trades in check.
How it works:
For Long exits, the line is drawn below the previous bar’s low minus the offset.
For Short exits, the line is drawn above the previous bar’s high plus the offset.
When price crosses the line, the position is closed, an arrow is plotted on the chart, and an alert is fired.
Ideal for traders who want strict stop management or automated exit conditions while keeping visual clarity on the chart.
Crashpattern

Bitcoin Daily Support/ResistanceA new indicator for tradingview.
Indicator Overview
The 2-Year MA Multiplier is intended to be used as a long term investment tool.
It highlights periods where buying or selling Bitcoin during those times would have produced outsized returns.
To do this, it uses a moving average (MA) line, the 2yr MA, and also a multiplication of that moving average line, 2yr MA x5.
Note: the x5 multiplication is of the price values of the 2yr moving average, not of its time period.
Buying Bitcoin when price drops below the 2yr MA (green line) has historically generated outsized returns. Selling Bitcoin when price goes above the 2yr MA x 5 (red line) has been historically effective for taking profit.
Why This Happens
As Bitcoin is adopted, it moves through market cycles. These are created by periods where market participants are over-excited causing the price to over-extend, and periods where they are overly pessimistic where the price over-contracts. Identifying and understanding these periods can be beneficial to the long term investor.
This tool is a simple and effective way to highlight those periods
MA 50/100/150 was historically good support and resistance. When we cross them we have a new trend that is established.

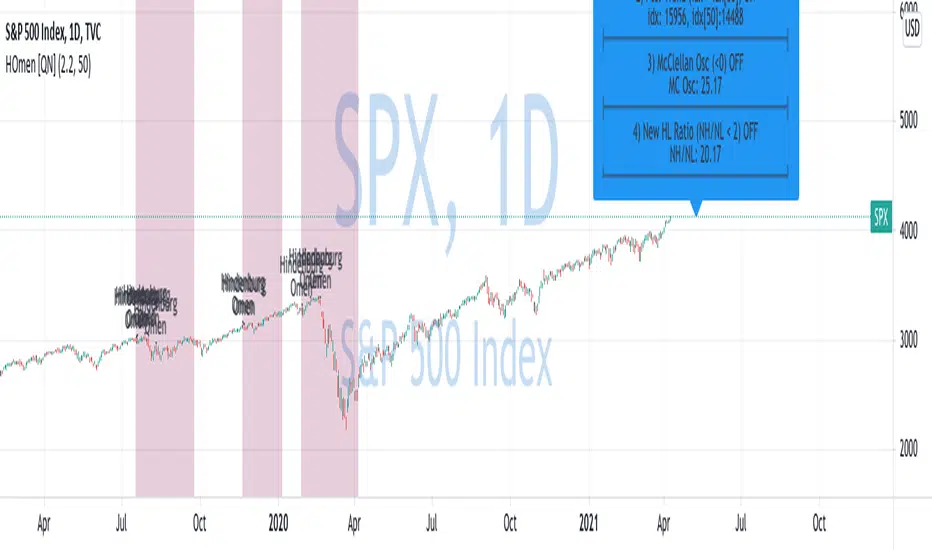
Hindenburg Omen [QuantNomad]New record highs is good time to look at a market crash indicators )
This is a Hindenburg Omen indicator.
The Hindenburg Omen looks for a statistical deviation from the premise that under normal conditions, securities are either making new 52-week highs or 52-week lows. The abnormality would be if both were occurring at the same time. According to the Hindenburg Omen, an occurrence such as this is considered to be a harbinger of impending danger for a stock market. The signal typically occurs during an uptrend, where new highs are expected and new lows are rare, suggesting that the market is becoming nervous and indecisive, traits that often lead to a bear market.
For it to be on 4 conditions should be satisfied:
1. Number of new 52-week highs and 52-week lows in a stock market are greater than a threshold (2.2% for example).
2. Positive recent trend. Index > index
3. The McClellan Oscillator (MCO) is negative.
4. 52-week highs cannot be more than two times the 52-week lows.
You can read more about the indicator on Investopedia:
www.investopedia.com
Based on indicator created by @Boombotcom: