Crossover


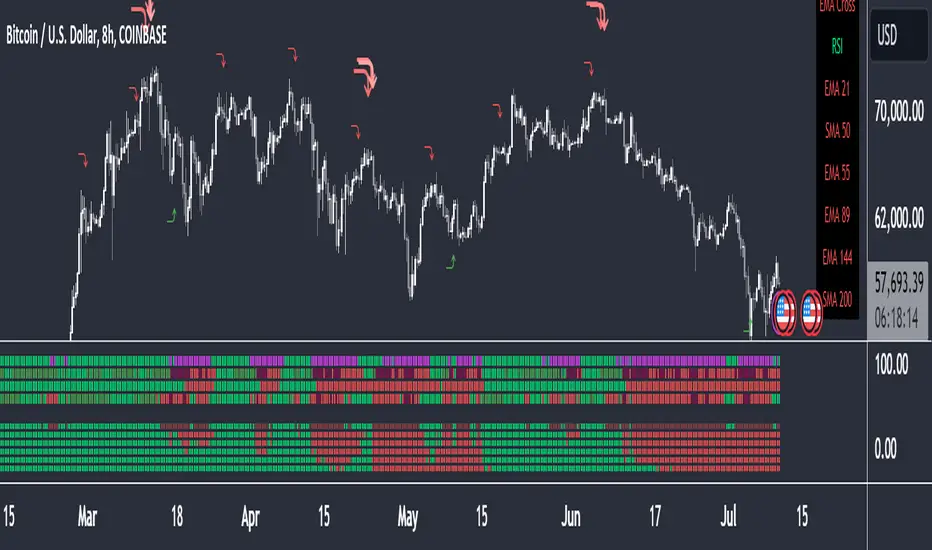
RSI Divergence Smoothed with Signal Line and Power ZonesThis Indicator plots Regular and Hidden Divergences lines for an RSI smoothed by an EMA and for its Signal Line
The RSI can be set to change colour with direction or can be set as single colour
Colour Changing RSI helps when trading Multiple Timeframes as you can look for confluence in the direction of RSI
The divergence script is thanks to @RicardoSantos, I've just adjusted it to suite my indicator
Remember that divergences work best when traded with the trend or very late in a trend when going against the trend
I have also added a Colour Changing Signal Line & Hima Reddy's Power Zones so now you can also
Take full advantage of trading; signal line crosses, 50 crosses and Power Zone RSI support and resistance

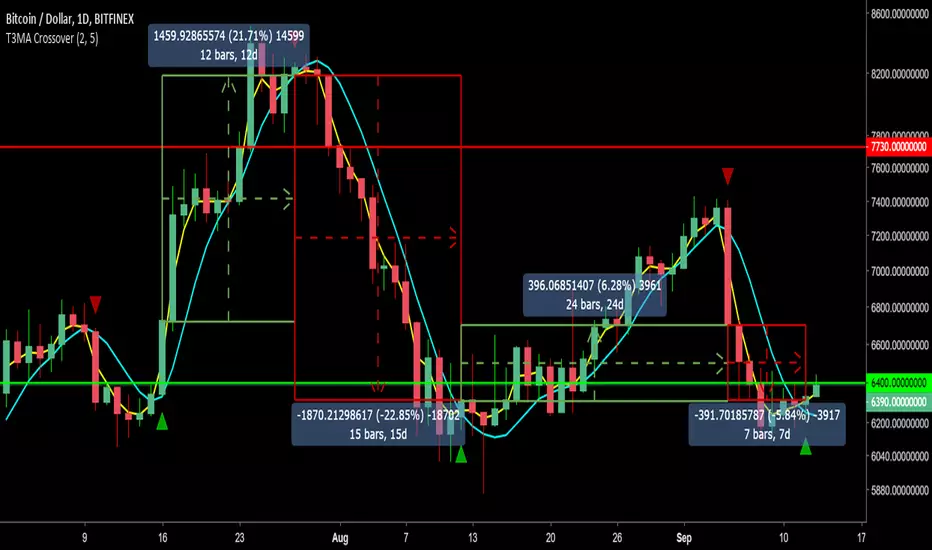
T3MA Crossover Strategy w/ Alerts v2.0Summary:
Using the T3MA formula developed by Tim Tillson, this differs from traditional SMA and EMA by providing a smoother curve and less lag. The smoothness is derived from the weighted sum of a single EMA through EMA 6 times.
How it works:
- Like any other crossover strategy.
- When fast MA crosses OVER the slow MA, go long.
- Close long and/or go short when the fast MA crosses UNDER the slow MA.
- Can keep flipping between long and short signals.
Quite a conservative strategy as it uses lagging indicators, not for intraday trading (you can, but I don't). Comes into it's own in trending markets as long as you stick to the signals.
Alert messages:
- Long
- Short
How I use it:
- My defaults are set at 2 fast MA and 5 slow MA to ride trends as close as possible.
- On BTCUSD and other altUSD pairs, I tend to use a daily time frame.
- On altBTC pairs, I tend to use a 12H time frame.
- Action on candle close at momentum confirmation (have seen numerous examples of a signal reversing mid candle into a dump).
Will need to be able to short altcoins to make the most of it, or it will at least keep you out of sustained downtrends (=/= holding).
Backtest it on bitcoin and other large cap alts on high time frames to see for yourself. For lazy trading, can set up alerts with AutoView.
0.1ETH for lifetime access. Message for details and support.
Adaptive MAs (MAMA, FAMA, KAMA)Adaptive moving averages a.k.a volatility-weighted moving averages are great tools for filtering out whipsawed trades as well as protecting the traders from premature exits when using stoploss. Adaptive moving averages are constructed in such a way that:
1) as volatility increases the sensitivity of the moving averages decreases, distancing the moving averages from price.
2) as volatility subsides, the sensitivity of the adaptive moving average starts to increase, drawing it closer to price action.
References:
stockcharts.com
www.mesasoftware.com
Find me on Twitter .

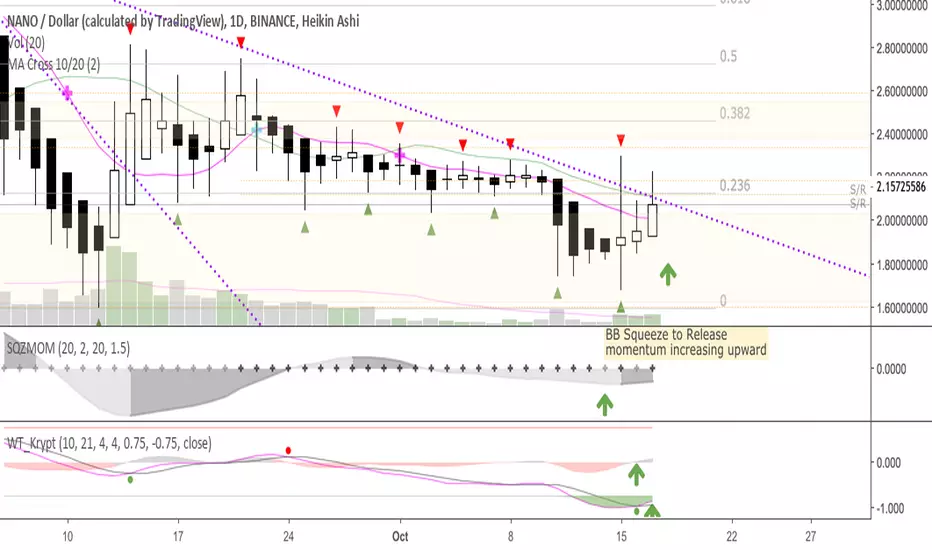
MA Cross 10/20This was originally derived from "MA Cross" indicator, though that one uses 9-21.
Simple 10day and 20day MA crossover indicator
* 10MA crosses from the bottom, goes up and above 20MA—we're bullish, look to long bullish signal candle
* 10MA crosses from the top, goes down and below 20MA—we're bearish, look to short bearish signal candle
Works well w/ Heikin Ashi candles

drnk_2emaChoose 2 period for daily ema and 2 period for hourly ema
from 1 minute to 1 hour time frames you will see same hourly EMAs
from 1 minute to 1 day time frames you will see same daily EMAs

EMA Cross - Indicator OnlySimple Indicator for Automated Trading Based on EMA Cross.
Displays the BUY/SELL.
Best used with the ALERTS Script.
PM for use.

EMA Cross Alerts /w Take Profit and StoplossSimple Alert for Automated Trading Based on EMA Cross.
Also includes the ability to add Take Profit, Stoploss, and Trailing.
PM for use.

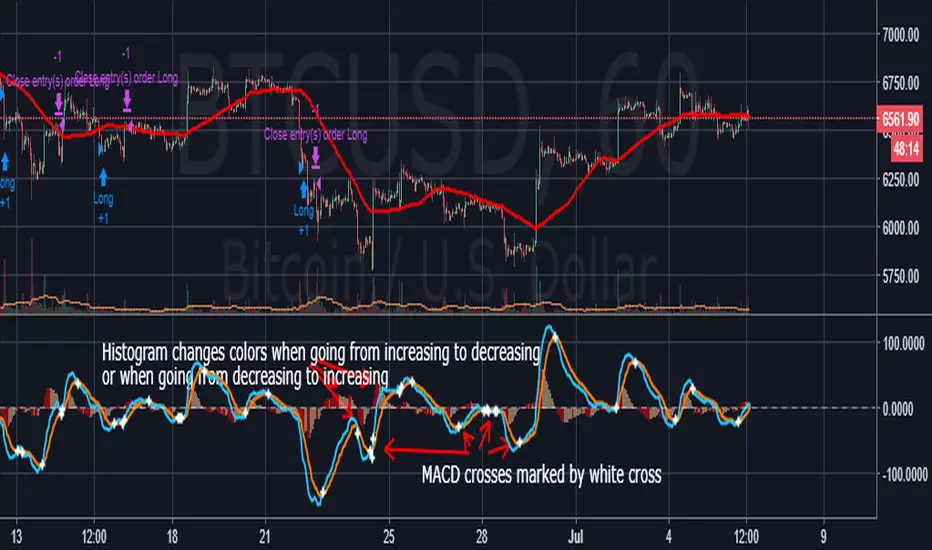
Better MACD with clearer cross and histogram signalsSimple but much needed visual improvements to the default MACD script. First, every time the MACD and signal cross, a white cross is placed on he chart, which lets you quickly identify the crosses. Second, whenever the histogram goes from increasing to decreasing or from increasing to decreasing, a color change occurs. Colors can be customized under "Style" tab under settings.
Reap Hull SMA CrossoverHi this is my first script, it is a HMA 144 crossover with SMA 5 changes background (still needs work), provides alerts for crossover

Vegas Wave - BronzeThe bronze edition of my code will be the most basic of a series of Vegas Wave codes which I will publish.
EMA 144, 169, 233
Vegas Tunnel - Highlights the price band between the 144 and 169 EMA.
Identifies support and resistance areas
Target price bounces and aid identifying EW counts.
Wave 2 retrace through the waves. Wave 4 bounce off Vegas Tunnel for example.
Provides confluence when used with fib targets and other indicators.
Identify EMA cross-overs and price crosses.
Easy to customise colours and shading for all time periods.
Multiple indicators in one (for those with TV limits).
Silver/Gold versions
I will include highlights/alerts for EMA/Price crossovers.
I hope its helpful and hopefully the first of many scripts to come.
Feel free to leave ideas and tips for future versions.

10 indicators in 1 : MACD RSI PIVOT EMA-CROSS and 7 EMA/SMA10 indicators in 1
MACD
RSI
PIVOT weekly:best
200 sma
100 sma
75 ema
55 ema
50 sma
20 ema
Golden EMA Crossover 13/48 based on tests Results of 1750 Moving Average Crossovers
Alert included, You can find "Bullish signal" and "Bearish signal" When you add Alert

Efmus System : 10 indicators in 1
10 indicators in 1
MACD
RSI
PIVOT weekly:best
200 sma
100 sma
75 ema
55 ema
50 sma
20 ema
Golden EMA Crossover 13/48 based on tests Results of 1750 Moving Average Crossovers :
etfhq.com
Efmus System : 10 indicators in 1
10 indicators in 1
MACD
RSI
PIVOT weekly:best
200 sma
100 sma
75 ema
55 ema
50 sma
20 ema
Golden EMA Crossover 13/48 based on tests Results of 1750 Moving Average Crossovers :
etfhq.com

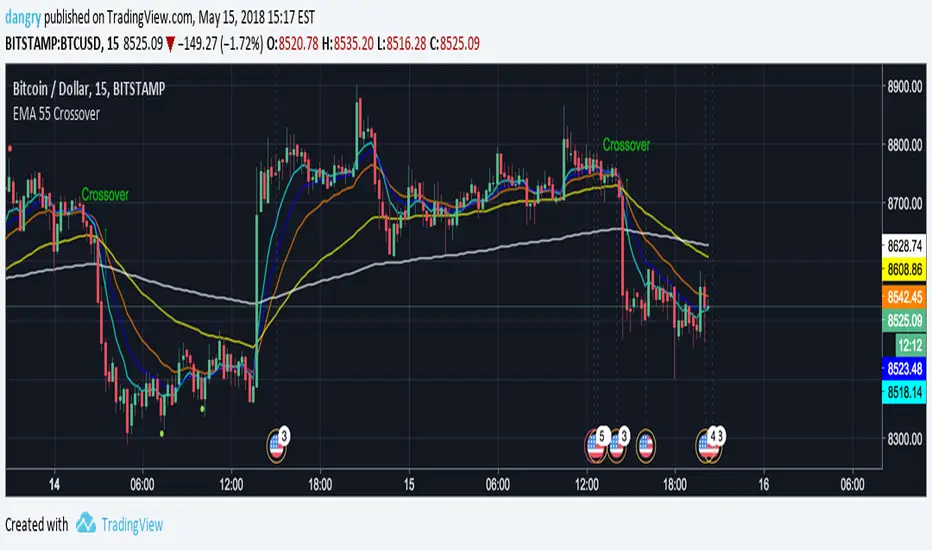
EMA 55 CrossoverBasically what this does is to flag when EMA 55 crosses over EMA 8, 13, 21, and 200. This strategy was described by @Philakone on this tweet , but I'm not really sure if this is the correct strategy he described.
Trend Continuation FactorTrend Continuation Factor indicator script.
This indicator was originally developed by M.H. Pee (Stocks & Commodities V. 20:3 (58-64): Trend Continuation Factor).

Frosted 12 EMAsBased on Vykorowsky's 6 EMAs.
This indicator creates 2 separate fans of 6 EMAs each (12 in total).
Everything is configurable in the settings screen.

Moving Averages (SMA and EMA)Plot the simple moving averages (SMA) and/or exponential moving averages (EMA).
The length of the lookback period and the type of moving average can be changed in the inputs tab of the indicator.
Line-weight and colours can be edited in the style tab of the indicator.
The default is to plot the SMAs using a length of 20, 50, 100 and 200.
