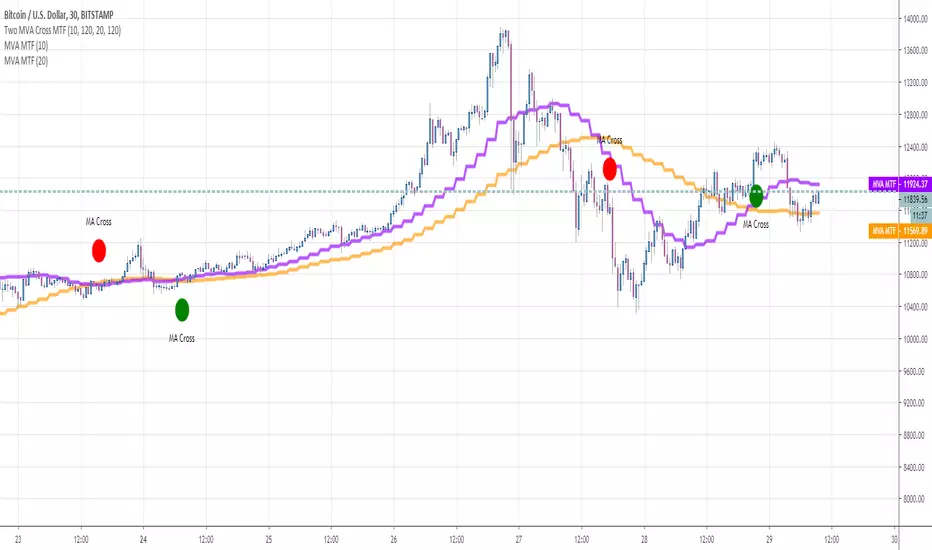
Two MVA Cross MTFHello traders
This is a script to apply the crossover/crossunder of moving average multi-timeframes on a different timeframe chart
In this example, we see two moving averages in the 2H timeframe being detected on a m30 chart
Enjoy
Dave
Crossover
Two MM CrossHello Traders
This is a script to detect the crossover/crossunder of two moving averages
It's generic as all standard moving averages are accepted and can be crossed between each other
Enjoy
Dave

24/9 EMA with Bias & SignalsThis is a simple indicator that plots the 24 & 9 EMAs.
It also highlights the potential bias of the market (bull or bear) based on if the 9 EMA is above or below the 24 EMA.
In addition there are signal crosses that you can use for alerts.
This indicator is best used to confirm a particular underlying bias on the 5m, 15M, 1HR, 4HR, and Daily timeframes.
It's important to note on lower timeframes that the bias can be counter trend bias of the overall larger momentum of the instrument you are trading.
For clarity this means that many retraces get going when the 9 crosses the 24. But ultimately the larger timeframe bias will continue after this counter trend retraces.
Combining this indicator with value channels and ATR is what I recommend.

Multiple Moving AveragesThis script shows multiple moving averages and has an indicator when they are about to cross. Depending on the scale you probably will need to adjust the values to have a working cross indicator.


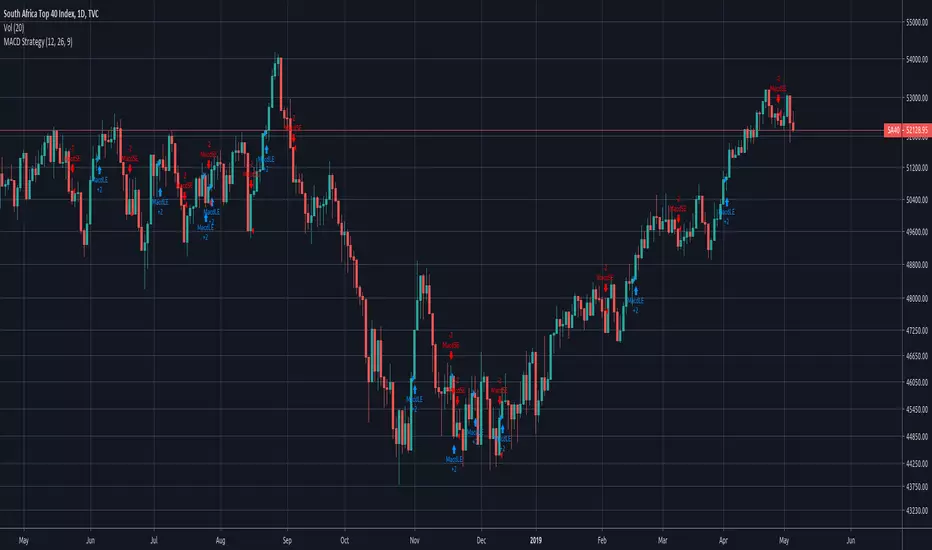
Simple MACD Strategy - CrossoverSimple MACD Crossover Strategy
No secret sauce here!
Script was requested by user
Simple Moving Average from Justin DartHi All,
This is my 1st script, what I want it to do is cut down on some of the SMA on my chart...
At the same time figure out , how to make a buy call that makes sense ( I Need work on it )...
I'm open to your input and your help...
Thanks...
Justin
DW-3 EMA Signal LineWhen the EMA is Green the Near EMA is above the Far EMA
When the EMA is Red the EMA Far is above the EMA Near
The color changes when the EMA Near and EMA Far cross
The single line EMA is the EMA Signal line
The EMA Signal line can be set at any look back period.
Changing the EMA Signal will not change when the EMA Near and EMA Far cross, or when the color of the EMA Signal changes
Changing the Look Back Period of the EMA Signal will change how near or far it is from current price
You can change the look back period of any of the EMAs
What this does for you.....
This allows you to implement an EMA Cross while only displaying 1 EMA on the chart.
This means less clutter and allows you to adjust your "warning track" for exit rules.
In other words your EMA for your exit rule does not have to be one of the EMAs crossing.
You can tighten your exit rule EMA closer or give it more room without effecting the cross parameter.
Notice that in these images the point at which the EMA changes color (the crossover) does not change
but the proximity to current price of the EMA Signal line does.
//@version=3
study("DW-3 EMA Signal Line",overlay=true)
//SMAs
// Open Source
//======================================================
EMA_Near = input(defval=8, type=integer)
EMA_Signal = input(defval=14, type=integer)
EMA_Far = input(defval=21, type=integer)
EMAblue = sma(close,EMA_Near)
EMAred = sma(close,EMA_Far)
//color = SMAblue > SMAred ? #6DBEE5 : red
color = EMAblue > EMAred ? lime : red
plot(ema(close,EMA_Signal),color=color,linewidth=4)

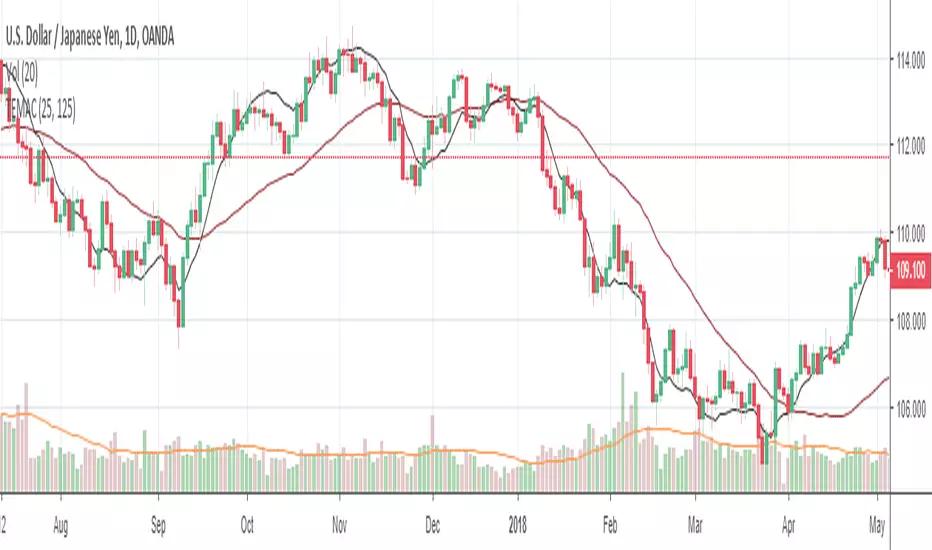
TEMA CrossoverTEMA is the Best Moving Average in terms of lag reduction.
Use this indicator to gauge the direction of the trend with the lowest lag possible.
TEMA CrossoverTEMA is the Best Moving Average in terms of lag reduction.
Use this indicator to gauge the direction of the trend with minimum amount of lag.

Dual EMA/SMA + Cross [SH]
I was missing an indicator that could show both an EMA and an MA with selectable source (open, close etc.) at the same time.
- Individually selectable EMA or MA.
- Option to highlight the bar where the MA's cross.
- Individually selectable source.
Not being pro it makes sense to have several indicators in one.
I hope someone finds this indicator useful.
Shaslund

The 6 Line Death PunchIf you are looking to discover what trend you are in, you need to first what direction the price is going in...
I've been using and testing a mixture of EMA's and SMA's for a long time and I've found that these ones are by far the best.
EMA 3
EMA 8
MA 20
EMA 55
MA 100
MA 200
EMA 3 & 8 Crossover is a good method for confirming a coin going to the upside or to the downside.
EMA 8 is known as the Trigger Line (trademarked brand) as one of the fib numbers it shows good support or resistance of a trend.
MA 20 universal way of seeing trend direction in the stock market, works well with crypto too.
EMA 55, another trusty fib number. Works very well and could trade off that alone as support and resistance.
MA 100 and MA 200. Long ranged moving averages which govern the overall longer-term trend.
LONG ENTRY
Option 1 - 3/8 crossover
Option 2 - Candles above EMA 8
Option 3 - Candles above MA 20
Option 4 - Candles Above EMA 55.
SHORT ENTRY
Option 1 - 3/8 crossover
Option 2 - Candles below EMA 8
Option 3 - Candles below MA 20
Option 4 - Candles below EMA 55.

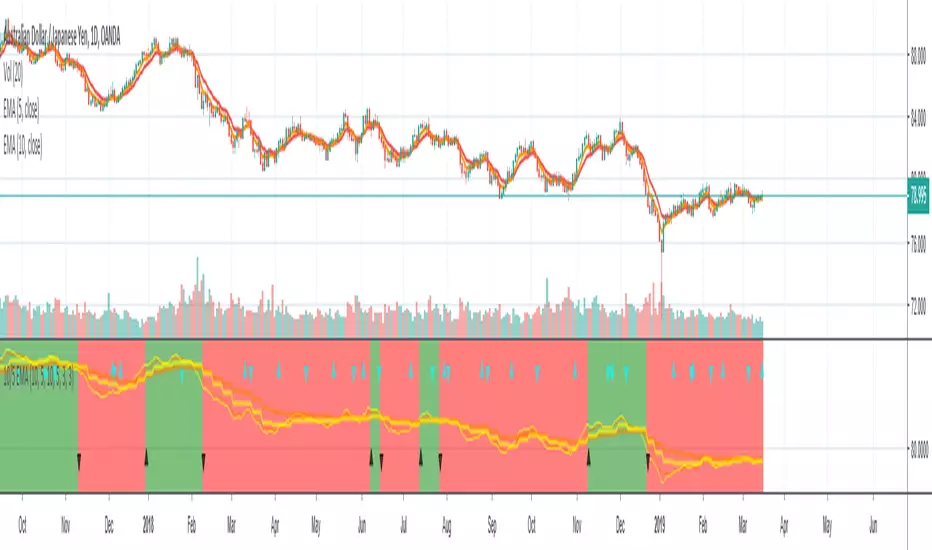
10/5 Weekly/Daily EMAs with ConfirmationsPlots Daily and Weekly 10 & 5 EMAs (but fully customizable to your own).
In addition to plotting the EMAs it color coordinates trend bias and has cross confirmation signals.
Philosophy and how to read:
I use this indicator when trading strictly on the daily timeframe. I have not tested it on other timeframes.
In my trade system I start with both the monthly and weekly charts to define overall bias.
Here’s the general rule of thumb.
10 EMA is direction (bias) and 5 EMA is price.
If 5EMA is below 10EMA there is a bear bias. If 5EMA is above 10EMA there is a bull bias.
This indicator will plot both the daily and weekly 10 & 5 EMAs.
It will also color code the background based on how these EMAs relate to each other.
Light red typically is just the daily is confirmed bear (typically because it could be either or)
Dark red, both daily and weekly in confirmed bear.
Light green, typically just daily is confirmed bull (typically because it could be either or)
Dark green, both daily and weekly in confirmed bull.
In addition to background highlight there is confirmation crosses.
The daily confirmation cross is default yellow triangle.
Down triangle is 5 crossing the 10 downward.
Up triangle is the 5 crossing the 10 upward.
The weekly confirmation is the same only is aqua color.
Generally, on a color change you want to see one or both confirmation in the direction of the bias change.
If you only want to plot the daily bias in the options unclick the setting: Include Weekly Background Plotting. Unclicking this will remove the background coloring for the weekly bias. This might be helpful if you only want to see the strength of what the weekly timeframe is telling you.
Also, I’m primarily a trend trader but I also do have a reversal system I trade with lower R:R parameters.
A good reversal confirmation signal I’ve noticed is the instrument that you are trading should go through a cycle of light color to dark color.
You could also create alerts with this indicator based on just signals. When the signal fires the value will be 1.
Future Updates:
I want to find some way to correlate the distance between these EMAs to enhance the signal. Also to include a velocity component. Plus a few more things.
If you like this indicator please like and leave a comment down below.
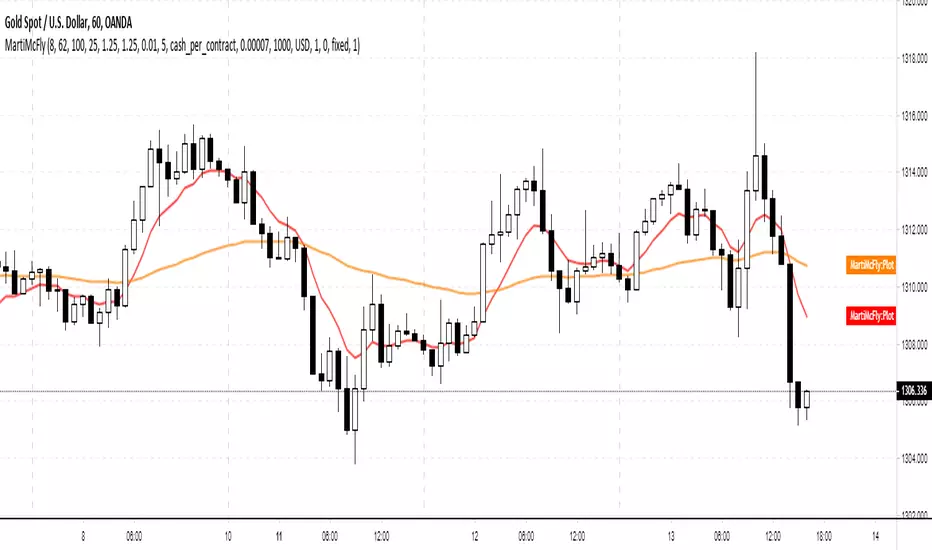
Decent Martingale Strategy [Pinescript v3]In my experimentation to add some sort of hedging to trades, I stumbled on the Martingale roulette betting strategy.
If it works in the casino, why not here?
The principle is simple:
If you lose a trade, immediately go the opposite direction and double your bet.
In this case, we're just applying a multiplier.
The strategy is a simple EMA crossover - defaulted to my favorite periods 8 and 62.
Enjoy :) I'll make a new one that's contained in a function, so you can simply implement it in your own strategy and have it monitor winning/losing trades automatically.
Cheers,
DasanC
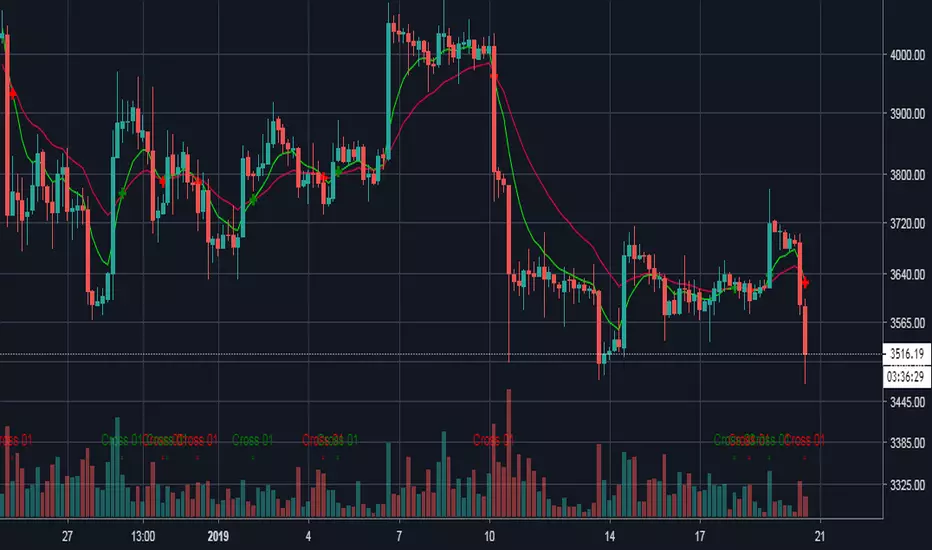
CryptoMatt GainMaker for ChartBulls StudentsThis script is intended for the ChartBulls Trading Students. The code is now open, so you can customize however you like. Cheers

Bitazu MA 5,10Displays 5,10 MAs on a single indicator.
Useful for Crypto trading and reduced the number of indicators needed to view multiple EMAs
When shorter MA crosses over the longer it's a good sign of Bullish/Bearish reversal.
This sentiment is more true at longer timeframes, such as daily candles, as the trend has more momentum.

Bitazu MA 10,20Displays 10, 20 MAs on a single indicator.
Useful for Crypto trading and reduced the number of indicators needed to view multiple MAs
When shorter MA crosses over the longer it's a good sign of Bullish/Bearish reversal.
This sentiment is more true at longer timeframes, such as daily candles, as the trend has more momentum.

Repulsion Moving Average - Least Crosses MAA Moving Average With Less Whipsaws Signals
The cross of the price with a moving average is one of the easiest strategy in technical analysis and could have worked if market price wasn't so noisy (In general periods of 1 to 20 produces the most whipsaws) . So it is possible to create a moving average who can manage to escape those noisy periods and produce 0 whipsaws ?
This question was asked by one of my work colleagues and i responded : "well... almost 0".
The Motion Of A Moving Average
Moving Average estimate the Trend and will always have phase shift, they will still follow the price and cross it during high volatility or low volatility periods, and when a moving average cross the price during a low volatility period you can expect lot of crosses.
In order to fix this behaviour a simple calculation exist :
FixMa = LongPeriodMA + MediumPeriodMA - ShortPeriodMA
We can see things in that way, the medium term MA is high pass filtered (subtracted) with a short term MA and the result is summed to a long term MA. We give more reactivity to our long term MA and thus creating some kind of repulsion motion with the price. Of course this can sometimes make the filter kinda zero-lag to some price periods (when the long term MA is near the price) .
Comparison
In red a simple moving average of period 100 and in blue our repulsion moving average :
In the image the short term moving average period is 100, since the long term period of the moving average is equal to short term x 3 you could be interested to look at the comparison of our moving average with the actual long term moving average :
Less crosses, i think you can see it.
Something to notice is that its always a tradeoff between Signal Speed and Signal Numbers , a classic moving average create faster signals but also a high numbers of them, a classic trailing stop create less signals but slowest ones, our moving average is some kind of average between those indicators.
Improvement Methods - Choice of The Filter/More Terms
A bad behaviour of our filter can be fixed by using filters who tend to create less crosses with the price or by developing the formula of our filter by adding more terms as follow :
fixma = ma(Price,a) + ma(Price,b) + ma(Price,c) - ma(Price,d) - ma(Price,e)
where a > b > c > d > e . The number of subtractive terms is equal to the number of summing terms - 1.
Way To Use
This indicator can be used like any moving average with cross strategy. Can also be used as a trailing stop.
No tests have been made proving that this indicator provide support and resistance levels, such signals come from more centered indicators.
Hope you enjoy
For any questions/demands feel free to pm me, i would be happy to help you :)

MA Crossover TypeDraws the up and down crossovers of a specified MA Type.
# Inputs
- MA Type: "sma", "ema", "swma", "vwma", "wma"
- Length >=1
- Source
- Offset >= 0
- Show cross Up?
- Show cross Down?
# Open Source
The code is open source @ github.com and uses the commonpine library github.com

13/21 EMA + Ichimoku Kinko Hyo StrategyThis trading strategy uses combination of the Ichimoku Kinko Hyo system with Fibonacci numbers based 13/21 exponential moving average ( EMA ) crossover, giving excellent results in trending assets !
